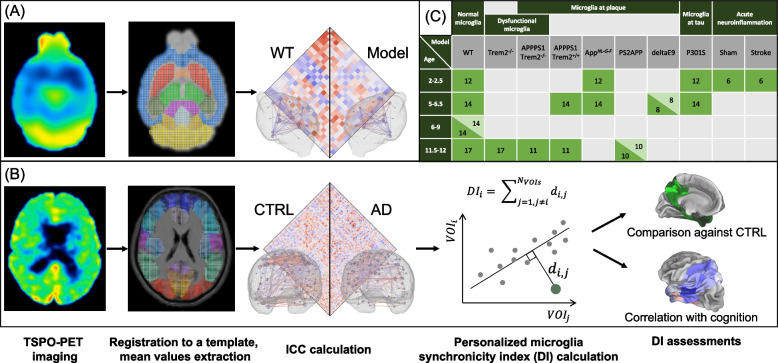
Fig. 1.
Study design. In both mouse (A) and human (B) studies, TSPO-PET images were registered to a tracer specific template. Based on extracted mean values, inter-correlation-coefficients (ICCs) were calculated. In the human study (B), we additionally calculated a microglia synchronicity index (desynchronization index, DI) for each subject on a single volume-of-interest (VOI) basis (see detailed explanation further in text and in Fig. 9A). For each VOI, we compared the DIs between studied cohorts and correlated it with two cognition scores. C Overview of mouse cohorts. The numbers in green indicate the number of mice in corresponding cohorts. Light green color stands for mice with pharmacologically depleted microglia (PLX5622). WT = wild type; AD = Alzheimer’s disease; CTRL = healthy control

