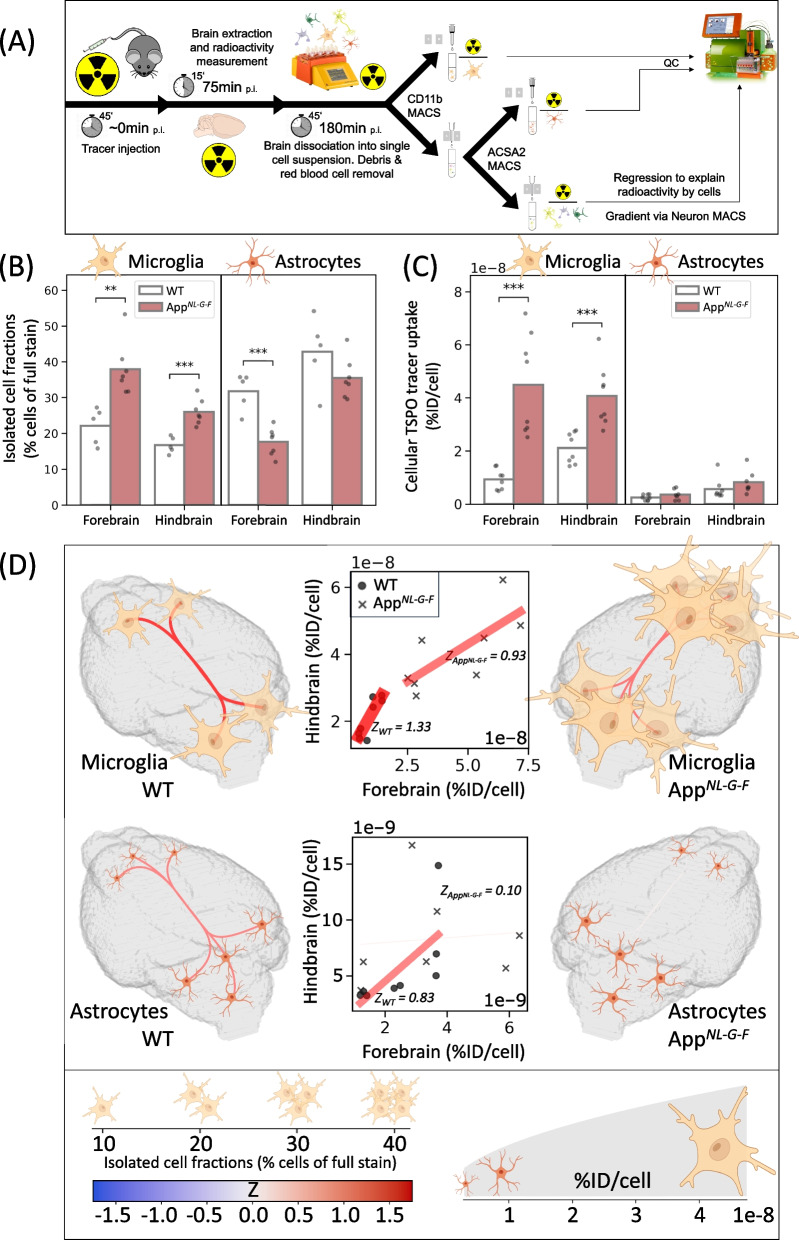
Fig. 11.
Single-cell radiotracing disentangles microglia as biological driver of TSPO-PET desynchronization in an AD mouse. A scRadiotracing workflow. B Percentage of isolated microglia and astrocytes fraction in the single cell suspension of WT (n=5) and AppNL-G-F mice (n=7). C Cellular TSPO tracer uptake in microglia and astrocytes as identified by scRadiotracing (WT: n=8, AppNL-G-F: n=8). Unpaired t-test: **: p < 0.01, ***: p < 0.001. Each point corresponds to a single mouse. D Graphical summary of (B) and (C): the number of cells in 3D brain images is proportional to the isolated cell fraction in the corresponding region; the size of the cells is related to the cellular TSPO tracer uptake in the region (square root relationship for display purpose). The scatter plots display the relationship between the cellular tracer uptake in the forebrain and the hindbrain; each point stands for a single animal; the straight lines represent linear fits calculated per cohort. Line color and thickness are proportional to Fisher’s Z and absolute Fisher’s Z, respectively, both in scatter plots and in 3D representations. Lower absolute Fisher’s Z corresponds to a higher degree of forebrain-hindbrain desynchronization. Estimated contributions of non-microglia/non-astrocyte cell types and gating strategies of quality control are presented in Supplementary Fig. S7

