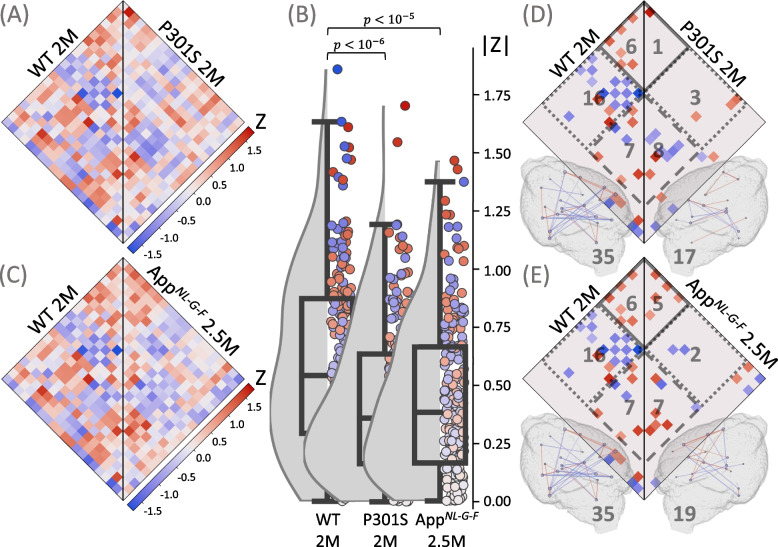
Fig. 4.
Assessment of microglia synchronicity in AD mouse models at the onset of neuropathology. Plots show ICC heatmaps, absolute ICC values and significant connections of the investigated AD mouse models at 2.0–2.5 months of age. A, D Wild-type (WT) mice (n = 12) versus P301S mice (n = 12). C, E WT mice versus AppNL−G−F mice (n = 12). A, C ICC values for all the pairs of the 21 VOIs. B Distributions of absolute ICCs, p-values derive from a Wilcoxon signed-rank test. D, E Significant connections (p < 0.005), including cortical (solid line), subcortical (dashed line), and cortical-subcortical (dotted line) connections; the number of the corresponding connections is shown in gray. All significant connections are also projected into 3D brain images, where the color of the connection represents its value; the nodes are individual VOIs, the size of the node reflects the number of its connections; the total number of connections is shown in gray

