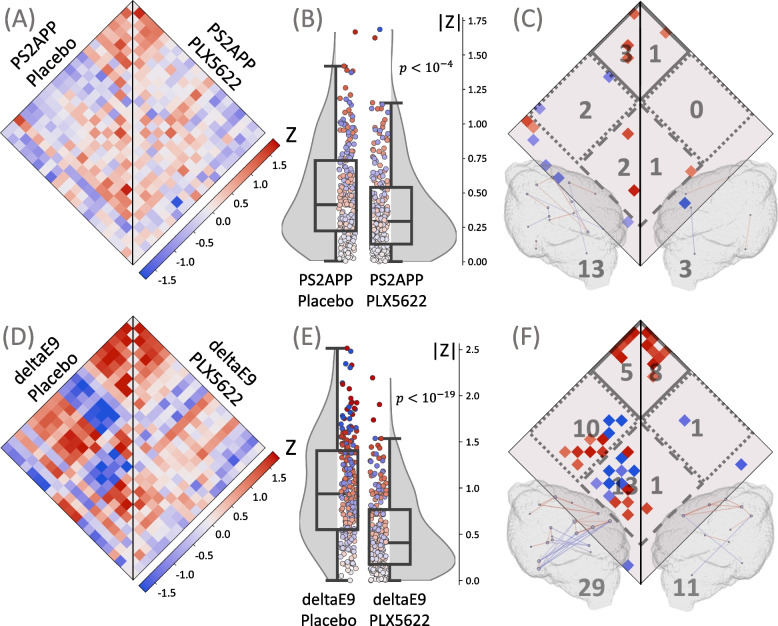
Fig. 6.
Assessment of microglia synchronicity in Aβ mouse models after microglia depletion. Plots show ICC heatmaps, absolute ICC values and significant connections of the investigated Aβ mouse models. A, B, C PS2APP mice with intact microglia (Placebo, n = 10) versus PS2APP mice with depleted microglia (PLX5622, n = 10). D, E, F DeltaE9 mice with intact microglia (Placebo, n = 8) versus deltaE9 mice with depleted microglia (PLX5622, n = 8). A, D ICC values for all the pairs of the 21 VOIs. B, E Distributions of absolute ICCs, p-values derive from a Wilcoxon signed-rank test. C, F Significant connections (p < 0.005), including cortical (solid line), subcortical (dashed line), and cortical-subcortical (dotted line) connections; the number of the corresponding connections is shown in gray. All significant connections are also projected into 3D brain images, where the color of the connection represents its value; the nodes are individual VOIs, the size of the node reflects the number of its connections; the total number of connections is shown in gray

