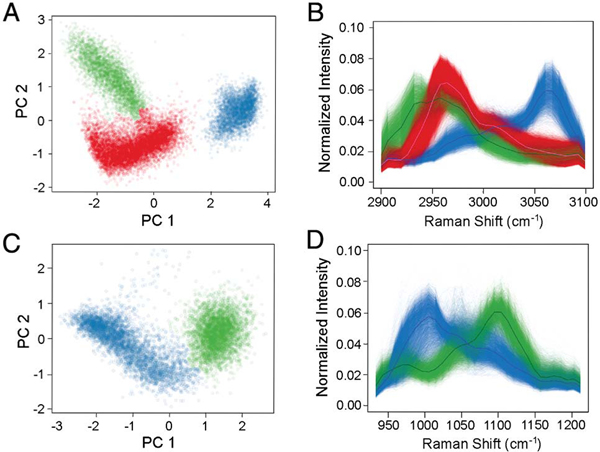
Fig. 4.
Chemical specificity in the SRS-FC analysis. (A) Color-coded CPCA scatter plot of SRS spectra from mixed PMMA (red), PS (blue), and PCL (green) beads. The data were acquired in 6 s using a bead mixture with a concentration of 2% solids. The beads were 10 μm in diameter. (B) SRS spectra of the three types of beads. The solid lines represent the averaged spectra from each separated population. The spectra were acquired in the C-H stretching region. (C) Color-coded CPCA scatter plot and (D) the corresponding SRS spectra of mixed PS (blue) and PCL (green) beads. The spectra were acquired in the Raman fingerprint region.

