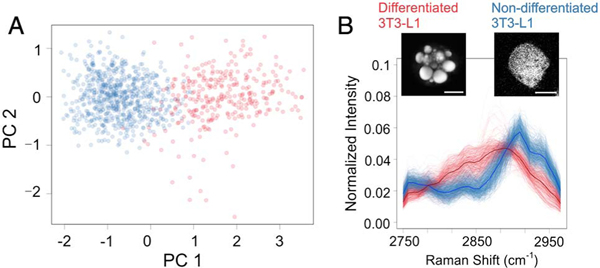
Fig. 5.
Analysis of lipid amount in 3T3-L1 cells in different differentiation states. (A) Color-coded CPCA scatter plot of SRS spectra from mixed differentiated and non-differentiated 3T3-L1 cells. The data were acquired in 3 s. (B) SRS spectra of the two cell populations separated by agglomerative clustering. The red and blue spectra represent differentiated and non-differentiated 3T3-L1 cells, respectively. The insets are SRS images of the two types of cells. The scale bars are 10 μm.

