Fig. 2.
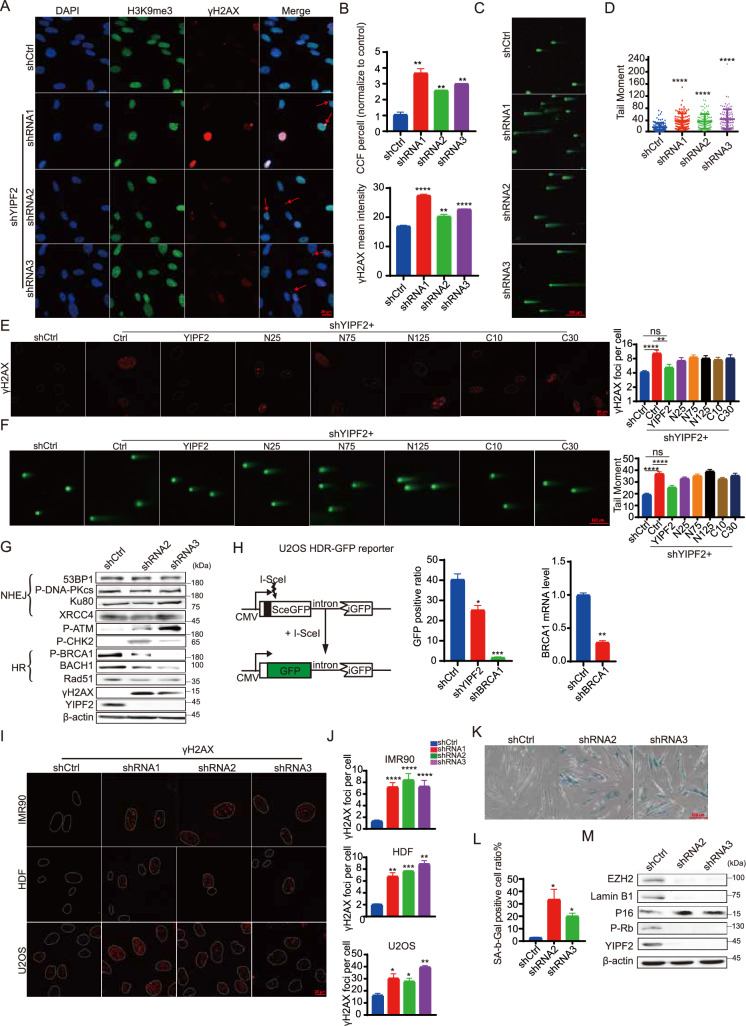
YIPF2 depletion impaired genomic integrity. A Detection of CCF foci in control and YIPF2-depleted IMR90 cells. The red arrow marks CCF. Scale bars, 20 μm. B Quantification of (A): the number of CCF foci per cell and nuclear γH2A.X signaling intensity (n ≥ 100). Error bars indicate mean ± SEM of three independent experiments. P values were calculated using a one-tailed Student’s t-test (**p < 0.01, ****p < 0.0001). C Detection of neutral comet assay in the control and YIPF2-depleted IMR90 cells. Scale bars, 100 μm. D Quantification of (C): the tail moment of each cell (n ≥ 100). Error bars indicate mean ± SEM of three independent experiments. P values were calculated using a one-tailed Student’s t-test (****p < 0.0001). E Detection of γH2A.X foci in the control and full-length or truncated YIPF2 construction in YIPF2-depleted IMR90 cells. Scale bars, 20 μm. F. Quantification of the tail moment of each cell (n ≥ 100). Error bars indicate mean ± SEM of three independent experiments. P values were calculated using a one-tailed Student’s t-test (****p < 0.0001). G Immunoblotting analysis of the DDR markers in control and YIPF2-depleted IMR90 cells. H Evaluation of the effect of YIPF2 on DNA damage repair using HDR-GFP reporter. Diagram of the U2OS HDR-GFP reporter (left). HDR activity in the control and YIPF2-depleted U2OS HDR-GFP cells were examined, knockdown of BRCA1 was chose as a positive control (middle). The BRCA1 mRNA level was confirmed by RT-PCR (right). Error bars indicate mean ± SEM of three independent experiments. P values were calculated using a one-tailed Student’s t-test (*p < 0.05, **p < 0.01). I Detection of γH2A.X foci in control and YIPF2-depleted IMR90 cells, HDF cells and U2OS cells. Scale bars, 20 μm. J Quantification of (I): the number of γH2A.X foci per cell (n ≥ 100). Error bars indicate mean ± SEM of three independent experiments. P values were calculated using a one-tailed Student’s t-test (****p < 0.0001, ***p < 0.001, **p < 0.01, *p < 0.05). K Detection of SA-β-gal activity in control and YIPF2-depleted IMR90 cells. Scale bars, 100 μm. L Quantification of (K): the percentage of SA-β-gal staining positive cells (n ≥ 100). Error bars indicate mean ± SEM of three independent experiments. P values were calculated using a one-tailed Student’s t-test (*p < 0.05). M Immunoblotting analysis of the cellular senescent markers in control and YIPF2-depleted IMR90 cells

