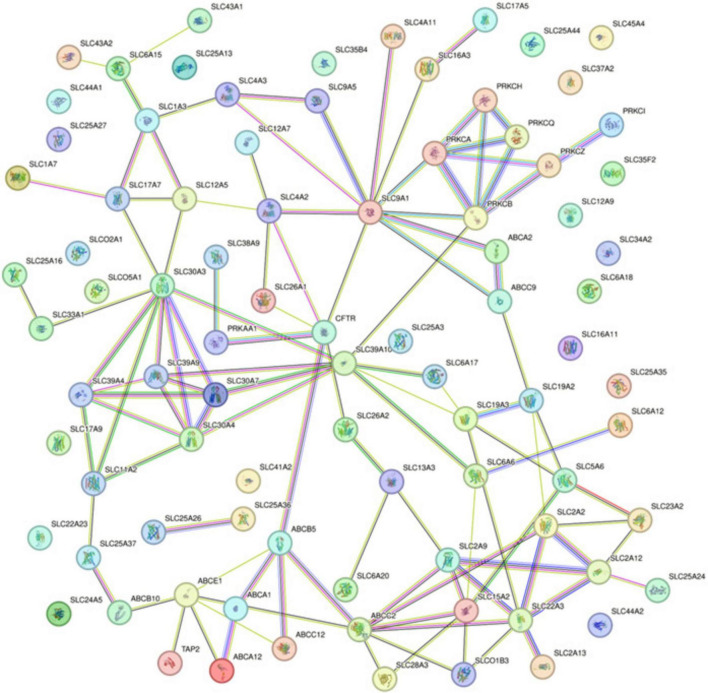
FIGURE 2.
Protein-Protein Interaction Network from STRING Analysis for Differentially Methylated Genes. Interactions are depicted as lines connecting nodes, which represent individual proteins. Line colors correspond to the type of evidence supporting the interaction: red for gene fusion; green for the neighborhood; blue for co-occurrence; purple for experimental; yellow for text mining; light blue for database evidence; and black for co-expression.

