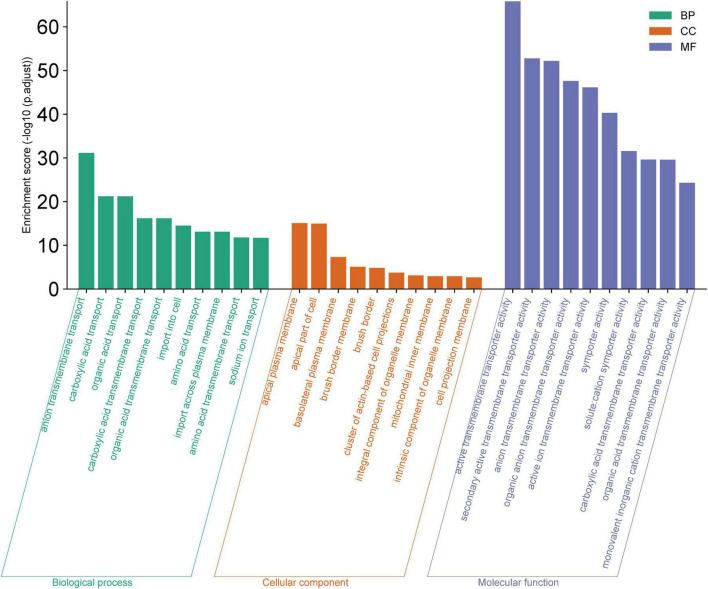
FIGURE 3.
Gene Ontology (GO) Analysis for Biological Process (BP), Cellular Component (CC), and Molecular Function (MF). The bar chart displays the enrichment scores (−log10 (p.adjust) for the top ten GO terms within each category. Elevated enrichment scores indicate a higher level of significance, suggesting that these GO terms are notably overrepresented in the dataset, and may be integral to the underlying mechanisms of the biological system being investigated.

