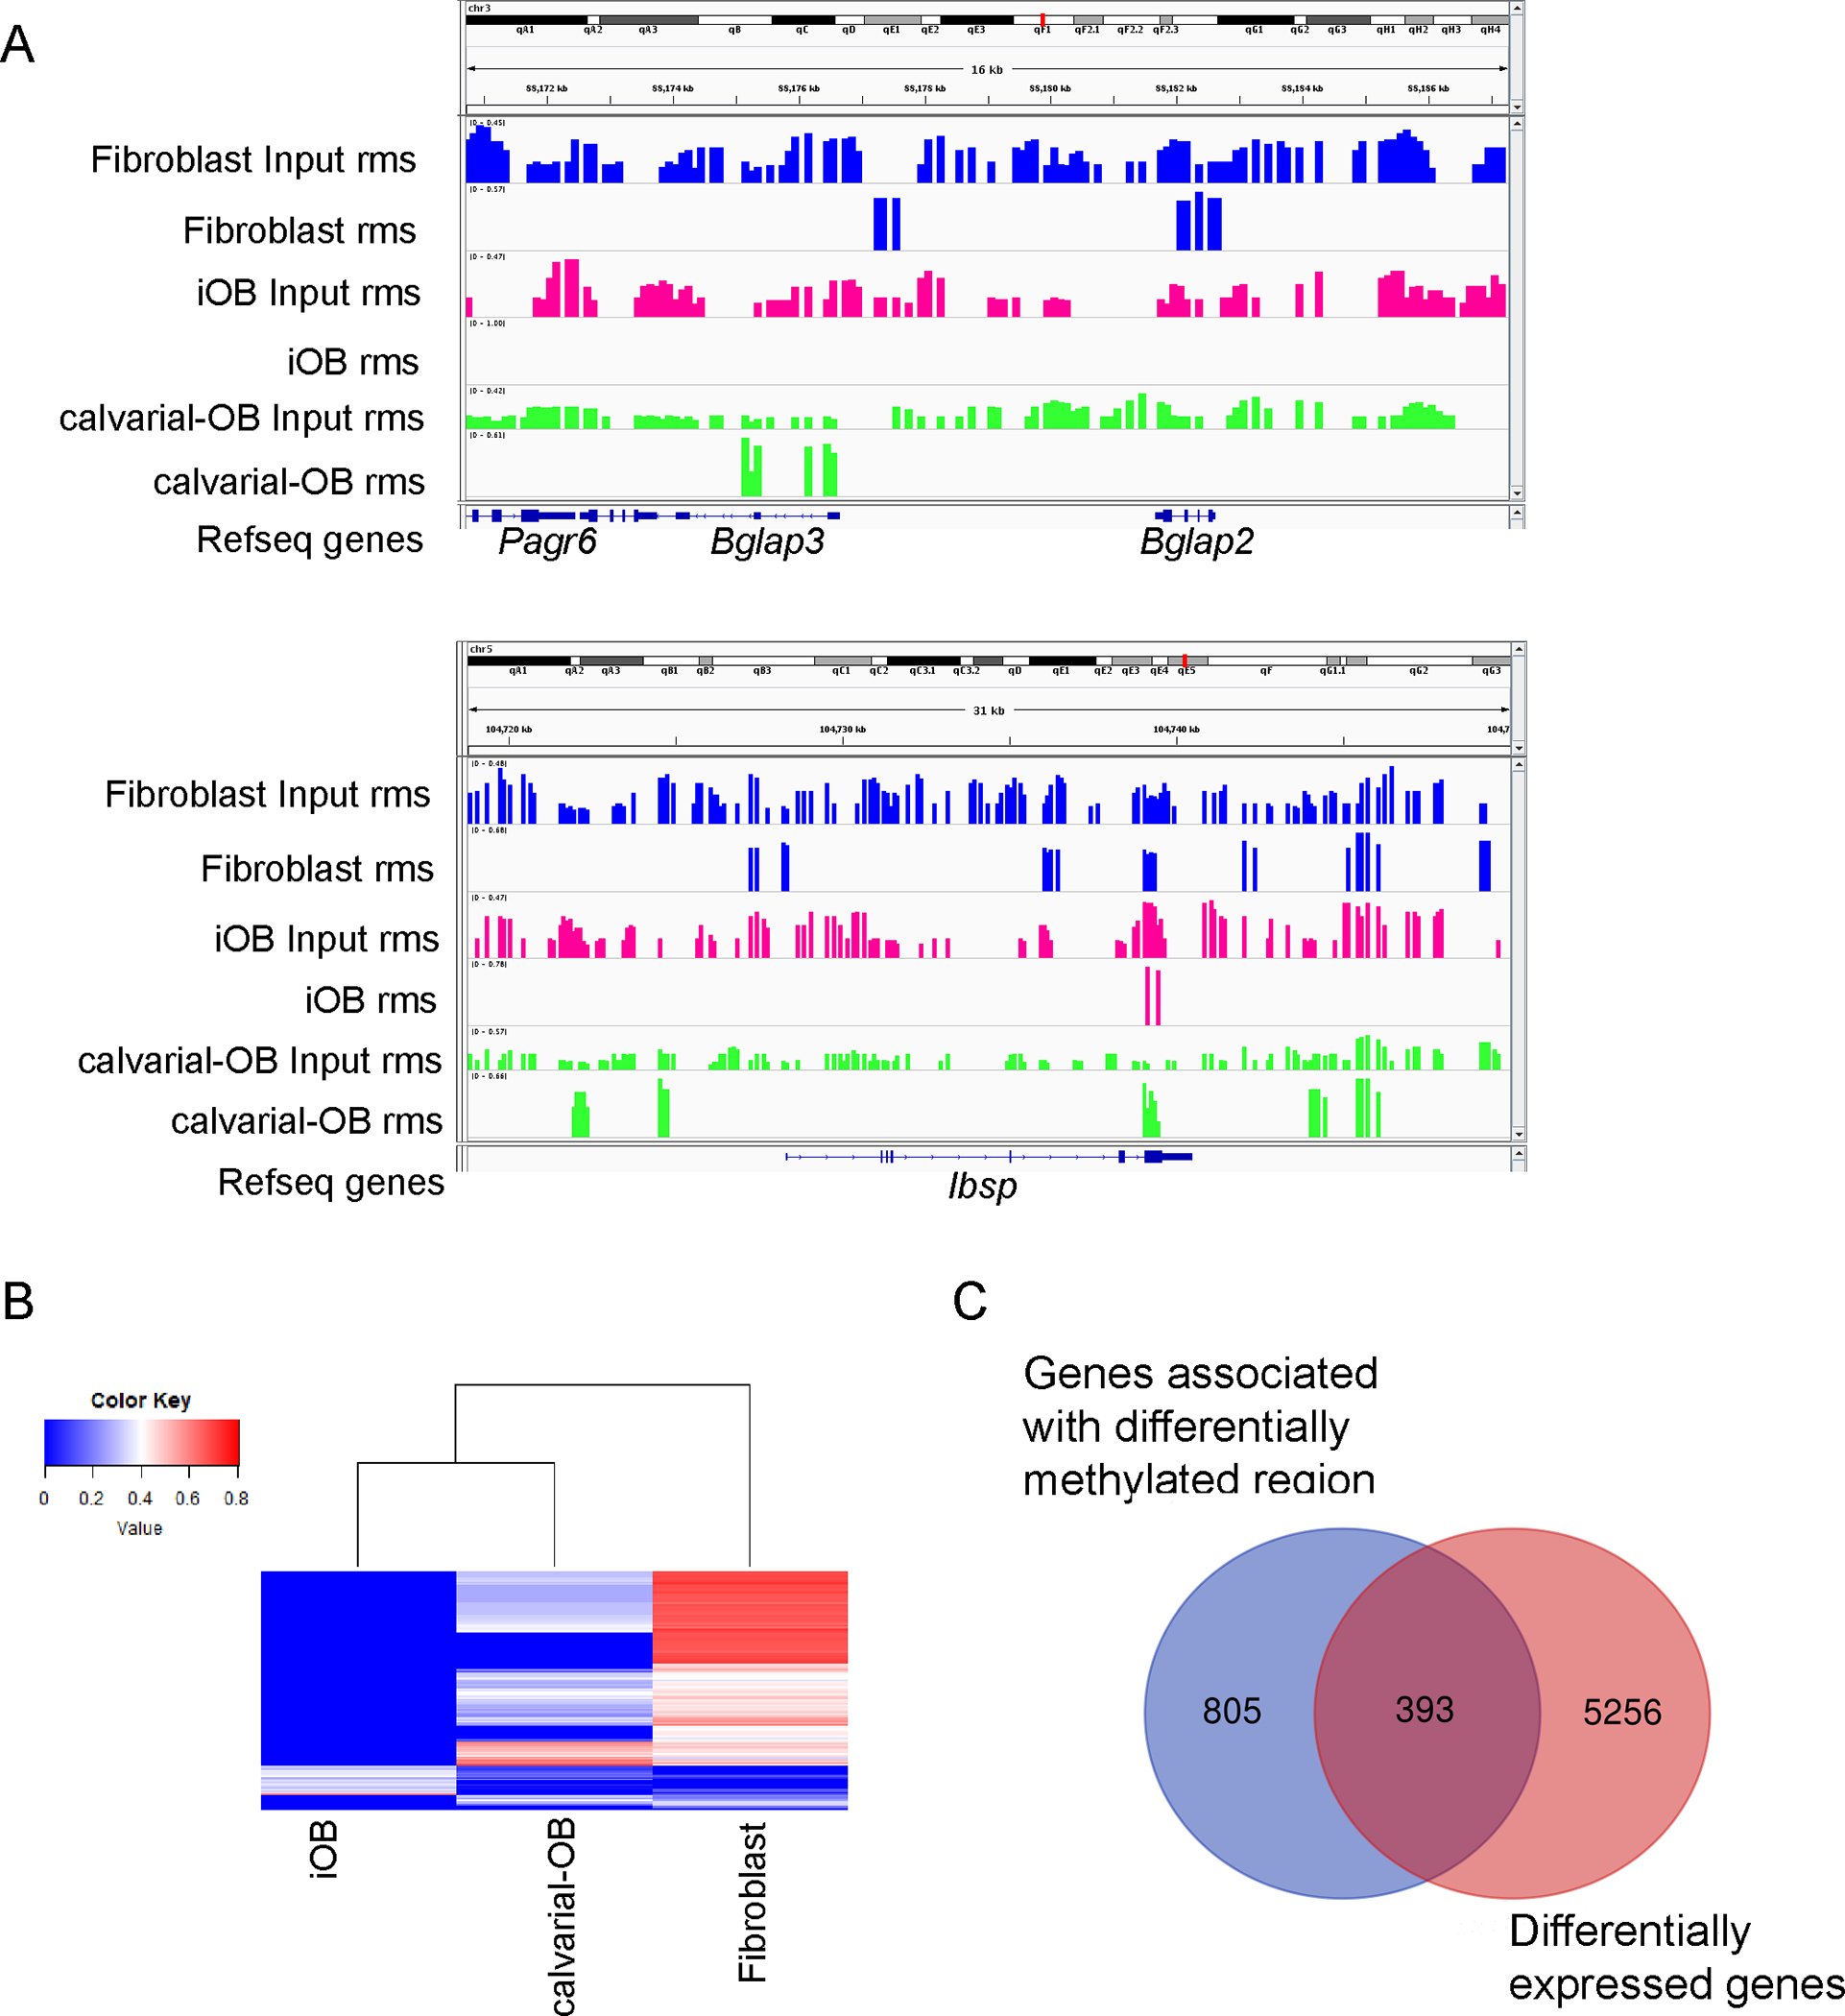
Figure 5.

iOB methylation status changes. (A) Decreased methylation peak in osteogenic marker Bglap3, Bglap2 and Ibsp locus. Visualization of regions was done by Integrative Genomics Viewer (IGV). Included tracks are rms (relative methylation score) for different groups. (B) Heatmap of mean rms values of differentially methylated regions (DMRs) in iOB versus fibroblast across samples. Each row represents a differentially methylated region. Each column represents a cell type. (C) The number of genes associated with differentially methylated regions (DMRs) is respected to the number of differentially expressed genes in iOB versus fibroblast.
