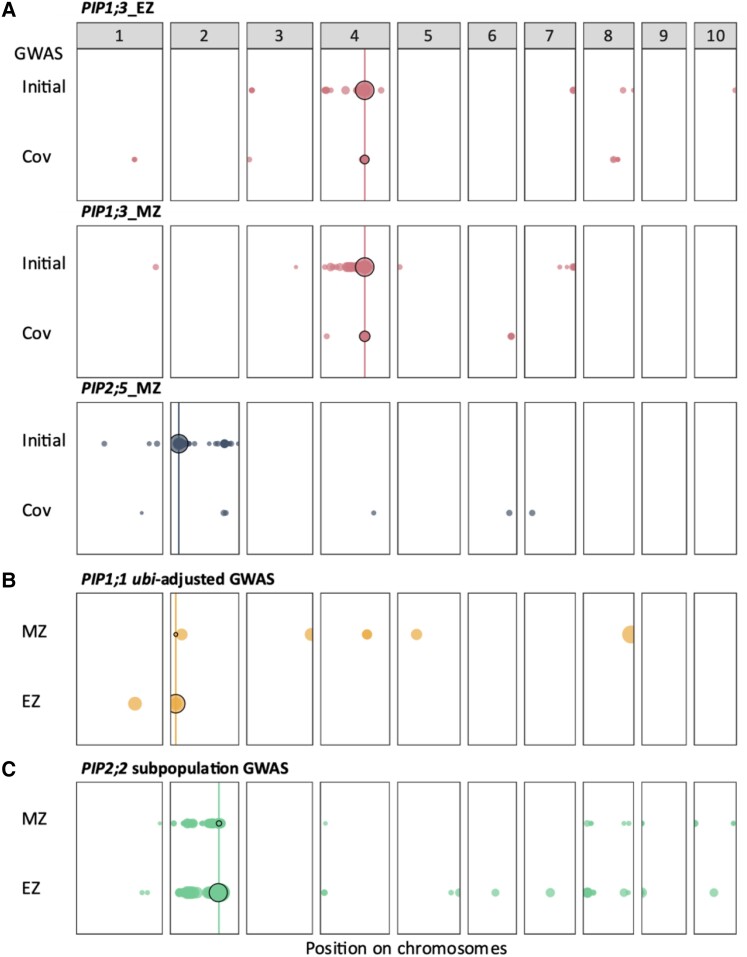
Figure 5.
Covariate GWAS. A) When large local eQTL peaks were detected (arbitrary cutoff at −log10(P-value) > 12), covariate GWAS was performed by integrating the local lead SNP as additional covariate in the model. Both initial and covariate (“Cov”) GWAS are shown for the concerned data sets. B) Ubi-adjusted GWAS for PIP1;1 traits. C) GWAS on subpopulation for PIP2;2 (220 lines), due to the detection of a low conservation at the location of the expected forward primer RT-qPCR hybridization. Dot diameter is proportional to the −log10(P-value). Vertical lines indicate the position of the PIP genes of interest, thus defining the local eQTLs circled in black. Physical positions of the markers are based on the B73 reference genome version 4. Significance threshold is set at 5.

