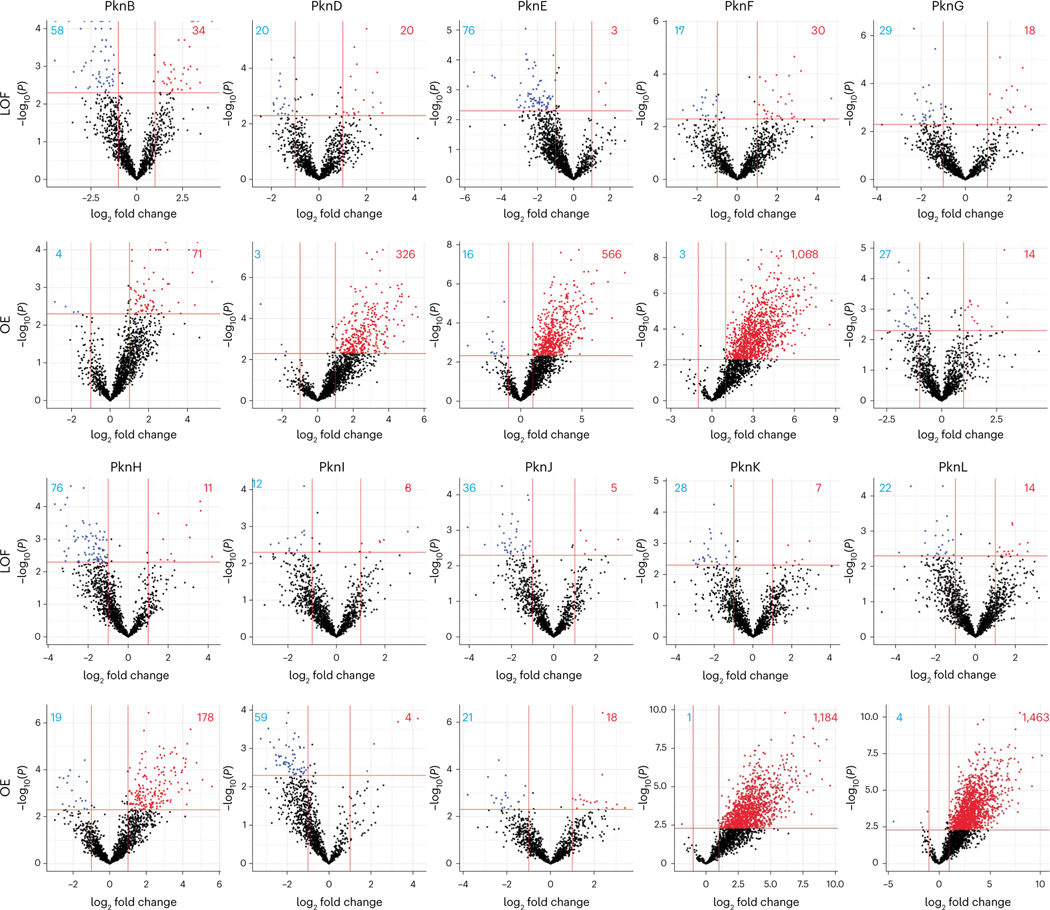
Fig. 2 |. STPK perturbation defines kinase–substrate interactions.
Magnitude and direction of changes in phosphorylation sites in LOF (rows 1 and 3) and OE strains (rows 2 and 4). The volcano plots show log2 fold changes in phosphorylation levels by phosphosite (x axis) versus the −log10 P value of the change (y axis). The horizontal and vertical lines show significance cut-offs applied to the data for further analysis (greater than two-fold change in abundance, P < 0.005). Significantly changing phosphosites are shown in red and blue and their numbers are given in the respective quadrant. STPKs altered in the respective strain were not included because they showed the largest changes and distorted the plots. Plots are shown with different scales to avoid compression of data points. Significance was determined by one-way ANOVA.

