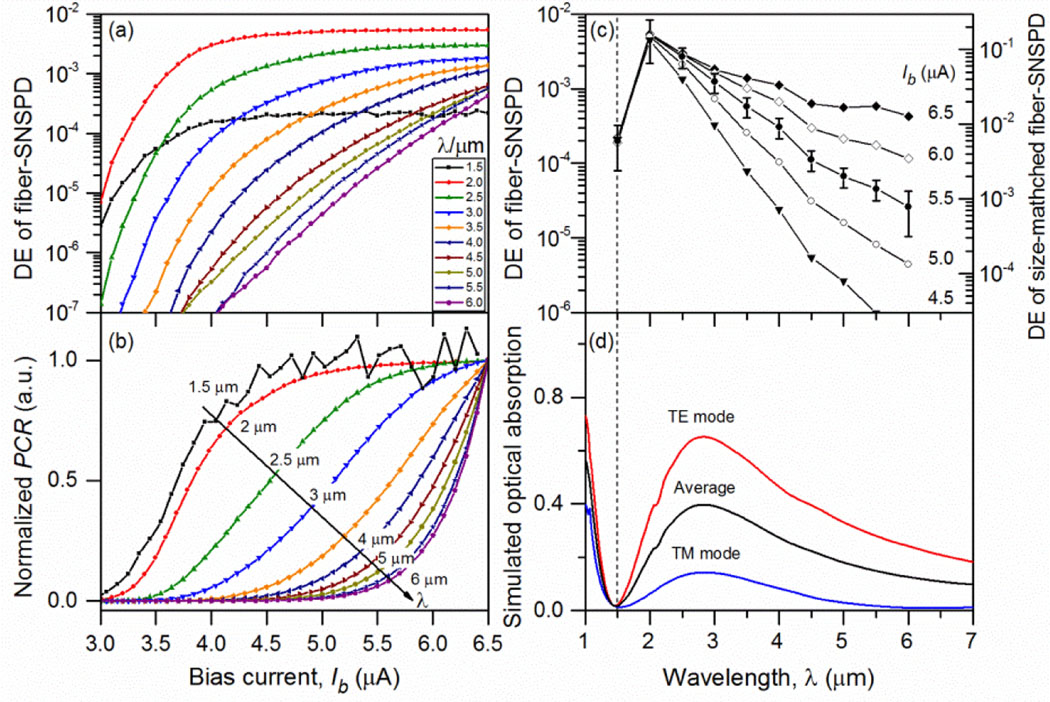
Fig. 2.

Detection efficiency (DE) of the fiber-SNSPD assembly. (a) Wavelength-dependent bias current () scans of DE at ; the switch current is ; (b) Normalized spectrum response of the WSi SNSPD plotted on a linear scale to illustrate the plateau in DE. At each wavelength, the measured scan curve is normalized to the photon counting rate (PCR) at . The 1.5 μm curve is noisy because of the low photon flux and the low system detection efficiency; (c) Wavelength-dependent DE obtained from data in Fig. 2(a) at several fixed . The error bars are only shown for data for clarity. The relative errors are in the range of 30%–50%, estimated based on uncertainties of the relative globar light intensity, the grating efficiency, and the SNSPD PCR measurements. The right-y axis shows the QE value when the size is matched between the SNSPD and the fiber, which results in 30 times higher fiber-coupling efficiency; (d) Wavelength-dependent optical absorption of the WSi SNSPD simulated based on parameters of the optical stack described in Fig. 1(b). The black absorption curve is the average of the TE mode (red curve) and TM mode (blue curve) absorption curves.
