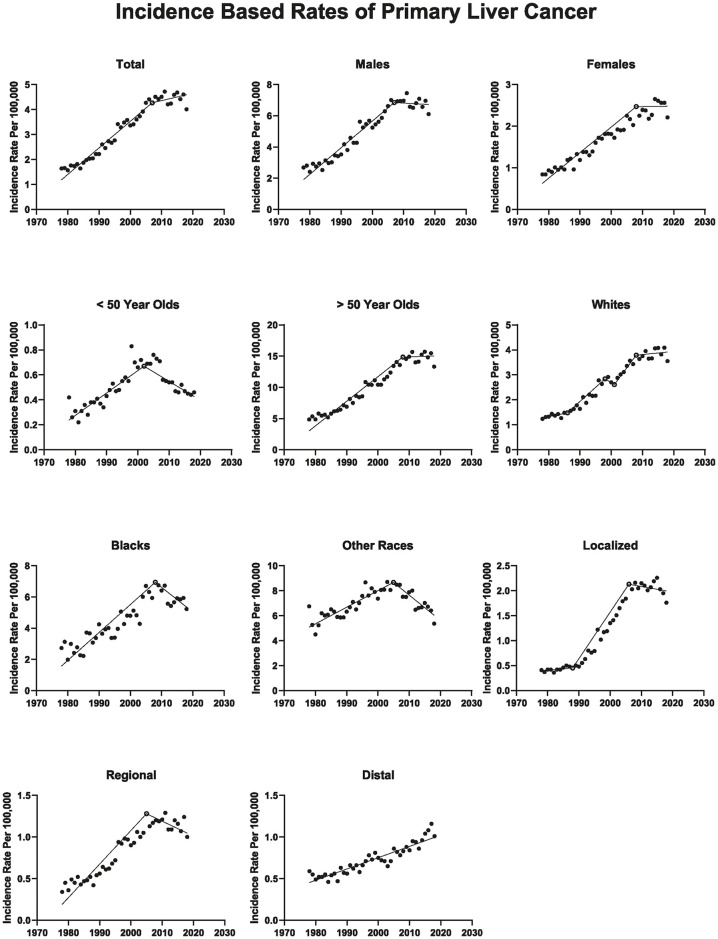
Fig 2. Age-standardized incidence rates of primary liver cancer in the SEER-9 US cancer registry, 1978–2018.
Solid circles represent incidence rates, open circles represent years with a significant change in annual percent changes in rates, and lines represent modeled rates using Joinpoint regression. The y-axis varies between figures.

