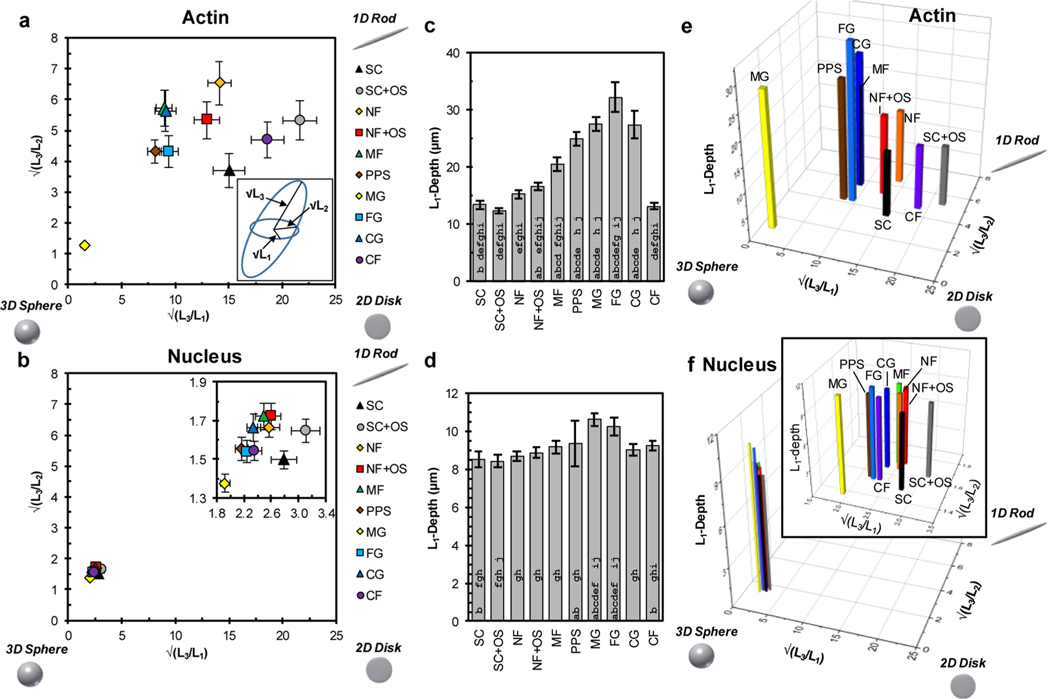
Figure 3.
Analysis of cell shape dimensionality. (a) Dimensionality plot of the ratios of the square roots of the gyration tensor ellipsoid principal moments for actin. Upper right corner is more 1D-character (rod), bottom right is more 2D character (disk), and bottom left is more 3D character (sphere). Inset: Gyration tensor ellipsoid with principal moments labeled; √(L1) is the shortest semiaxis, √(L2) is the middle semiaxis, and √(L3) is the longest semiaxis. (b) Dimensionality plot of the ratios of the square roots of the gyration tensor ellipsoid principal moments for nucleus. Inset: Expanded view of the data. (c) L1-depth for actin. L1-depth is the depth of the cell parallel to the L1-axis (caliper distance) representing the thinnest cell dimension and is a gauge of cell height. (d) L1-depth for nucleus. (e) 3D plot of the √(L3/L1), √(L3/L2), and L1-depth for actin using data from panels a and c. (f) 3D plot of the √(L3/L1),√(L3/L2), and L1-depth for nucleus using data from panels b and d. Approximately 100 cells were imaged for each scaffold (Table 1) and error bars represent 2 standard deviations of the mean. In panels c and d, bars with an a, b, c, d, e, f, g, h, i or j are significantly different from SC, SCOS, NF, NFOS, MF, PPS, MG, FG, CG, or CF, respectively (P < 0.05, 1-way ANOVA with Tukey’s test, Figure S3).

