. 2024 Jun 24;38:e053. doi: 10.1590/1807-3107bor-2024.vol38.0053

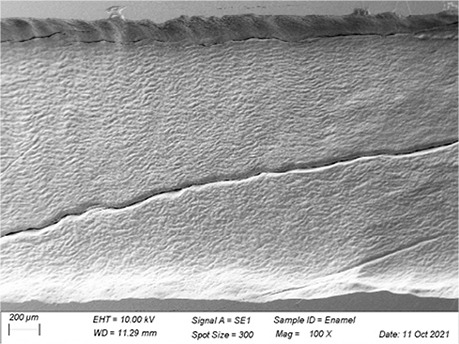
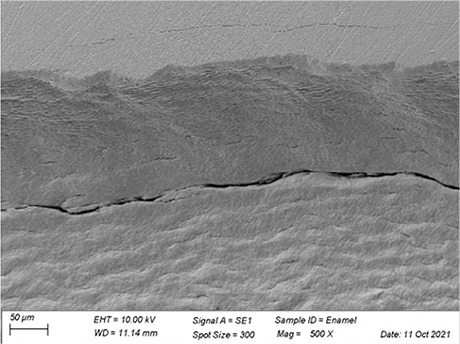
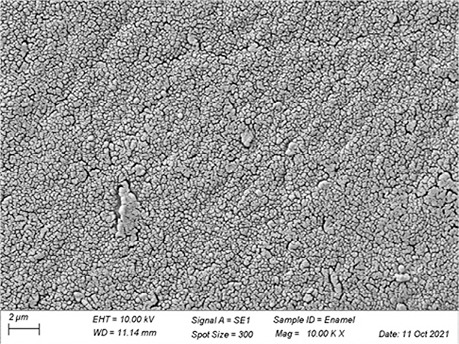
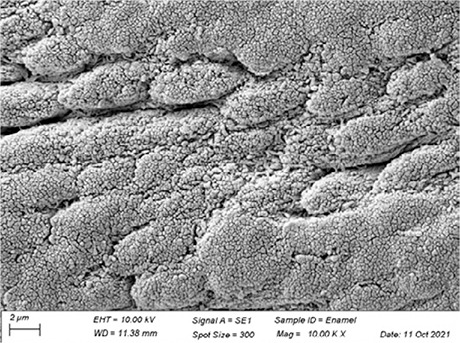
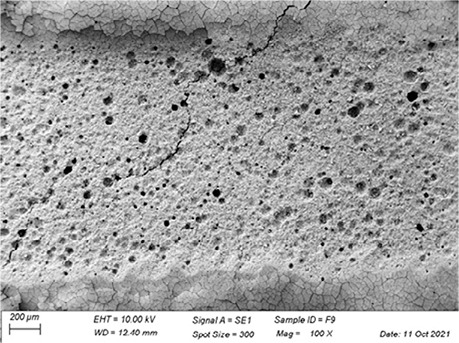
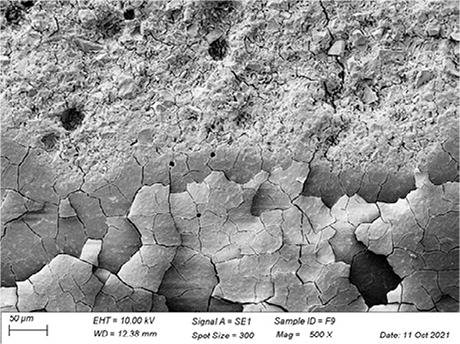
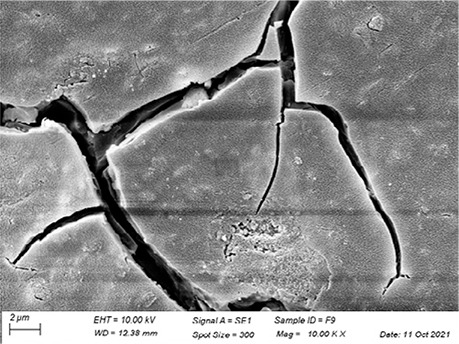
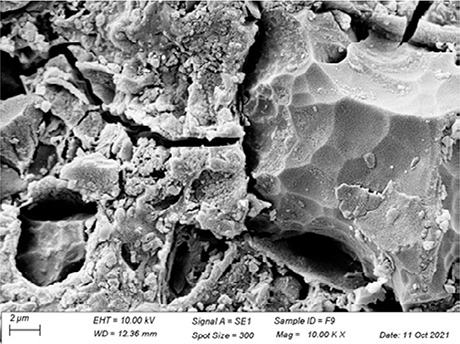
Table 3. Representative topographic images in scanning electron microscopy (SEM; 100×, 500× and 10K×) of the specimens after the acid citric challenge.

Group Topographic images

SEM (100×) SEM (500×) SEM (10K×)
  Baseline Eroded area
Enamel (Ctrl) graphic file with name 1807-3107-bor-38-e053-ii01.jpg graphic file with name 1807-3107-bor-38-e053-ii02.jpg graphic file with name 1807-3107-bor-38-e053-ii03.jpg graphic file with name 1807-3107-bor-38-e053-ii04.jpg
Fuji IX graphic file with name 1807-3107-bor-38-e053-ii05.jpg graphic file with name 1807-3107-bor-38-e053-ii06.jpg graphic file with name 1807-3107-bor-38-e053-ii07.jpg graphic file with name 1807-3107-bor-38-e053-ii08.jpg