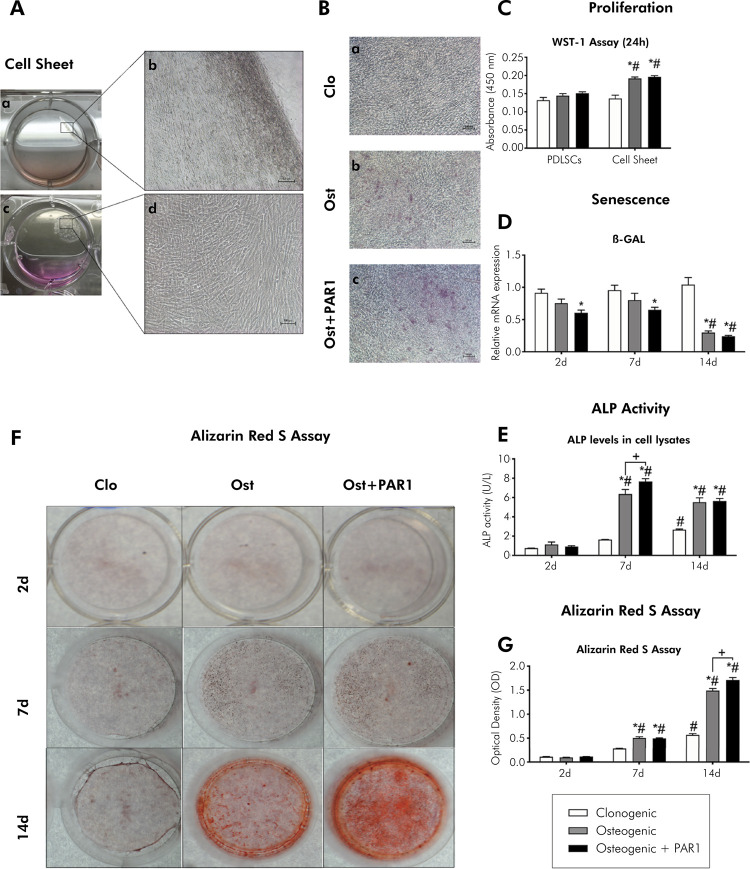
Figure 2. Cell sheet culture and osteogenic differentiation. Representative images. A) a) Macroscopic aspect of cell sheet detaching from the culture plate; b) Microscopic aspect of a detail (scale bar = 100 μm); c) Macroscopic aspect of detached cell sheet; d) Microscopic aspect of a detail (scale bar = 100 μm). B) Microscopic aspect of cultured cell sheets after 14 days of induction of osteogenic differentiation with a) Clonogenic (control), b) Osteogenic, and c) Osteogenic+PAR1 medium (scale bar = 100 μm). C) Cell proliferation (WST-1 Assay). D) Gene expression during induction of osteogenic differentiation in vitro (β-GAL). Calibrating sample: undifferentiated PDLSCs (P4). Housekeeping gene: GAPDH. E) Quantification of alkaline phosphatase (ALP) activity. F) Macroscopic aspect of mineralized nodules formed after 2, 7, and 14 days of induction of osteogenic differentiation by Alizarin Red S staining in the analyzed groups. G) Quantification of Alizarin Red S Assay.
C, D, E and G) White bar indicates clonogenic, gray bar indicates osteogenic, and black bar indicates osteogenic + PAR1 medium group. *Statistically significant difference in relation to the clonogenic group (control) in the same experimental period. #Statistically significant difference in relation to the 2-day experimental period. +Statistically significant difference between groups within the same experimental period. Two-way ANOVA and Tukey’s post-hoc test (p> 0.05). Data are presented as mean and standard deviation.

