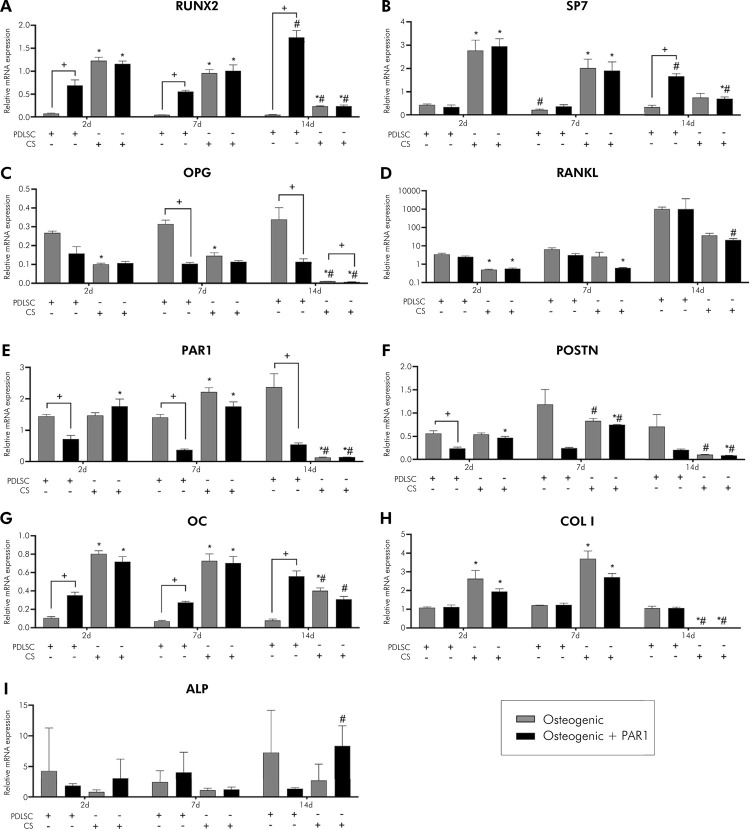
Figure 3. A) to I) Gene expression during induction of osteogenic differentiation in vitro of PDLSCs and cell sheet (RUNX2, SP7, OPG, RANKL, PAR1, POSTN, OC, COL I, and ALP) for 2, 7, and 14 days. Calibrating sample: undifferentiated PDLSCs (P4). Housekeeping gene: GAPDH. Gray bar indicates osteogenic and black bar indicates osteogenic + PAR1 medium group.
*Statistically significant difference in relation to the equivalent PDLSC group in the same experimental period. #Statistically significant difference in relation to the 2-day experimental period. +Statistically significant difference within the same group in the same experimental period. Two-way ANOVA with Tukey’s post-hoc test (p > 0.05). Data are presented as mean and standard deviation.

