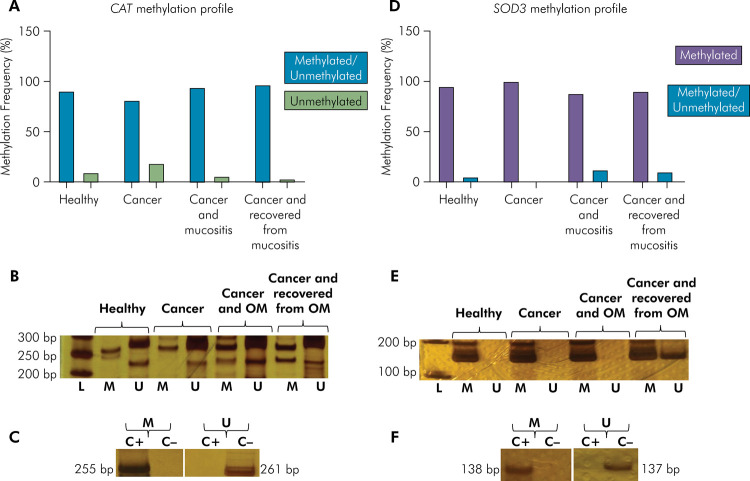
Figure 1. CAT and SOD3 methylation profile in oral cells of the study population (n=85). (A) Methylation frequency for CAT. (B) Representative bands showing CAT MSP reactions. (C) Representative bands showing the specificity of CAT MSP reactions. (D) Methylation frequency for SOD3. (E) Representative bands showing SOD3 MSP reactions. (F) Representative bands showing the specificity of SOD3 MSP reactions.
L: DNA ladder; bp: base pair; M: methylated; U: unmethylated; C+: fully methylated DNA; C-: fully unmethylated DNA; OM: oral mucositis. Note: methylated and unmethylated profiles are also known as partially methylated. Methylated profile is also known as hypermethylated. Unmethylated profile is also known as hypomethylated.

