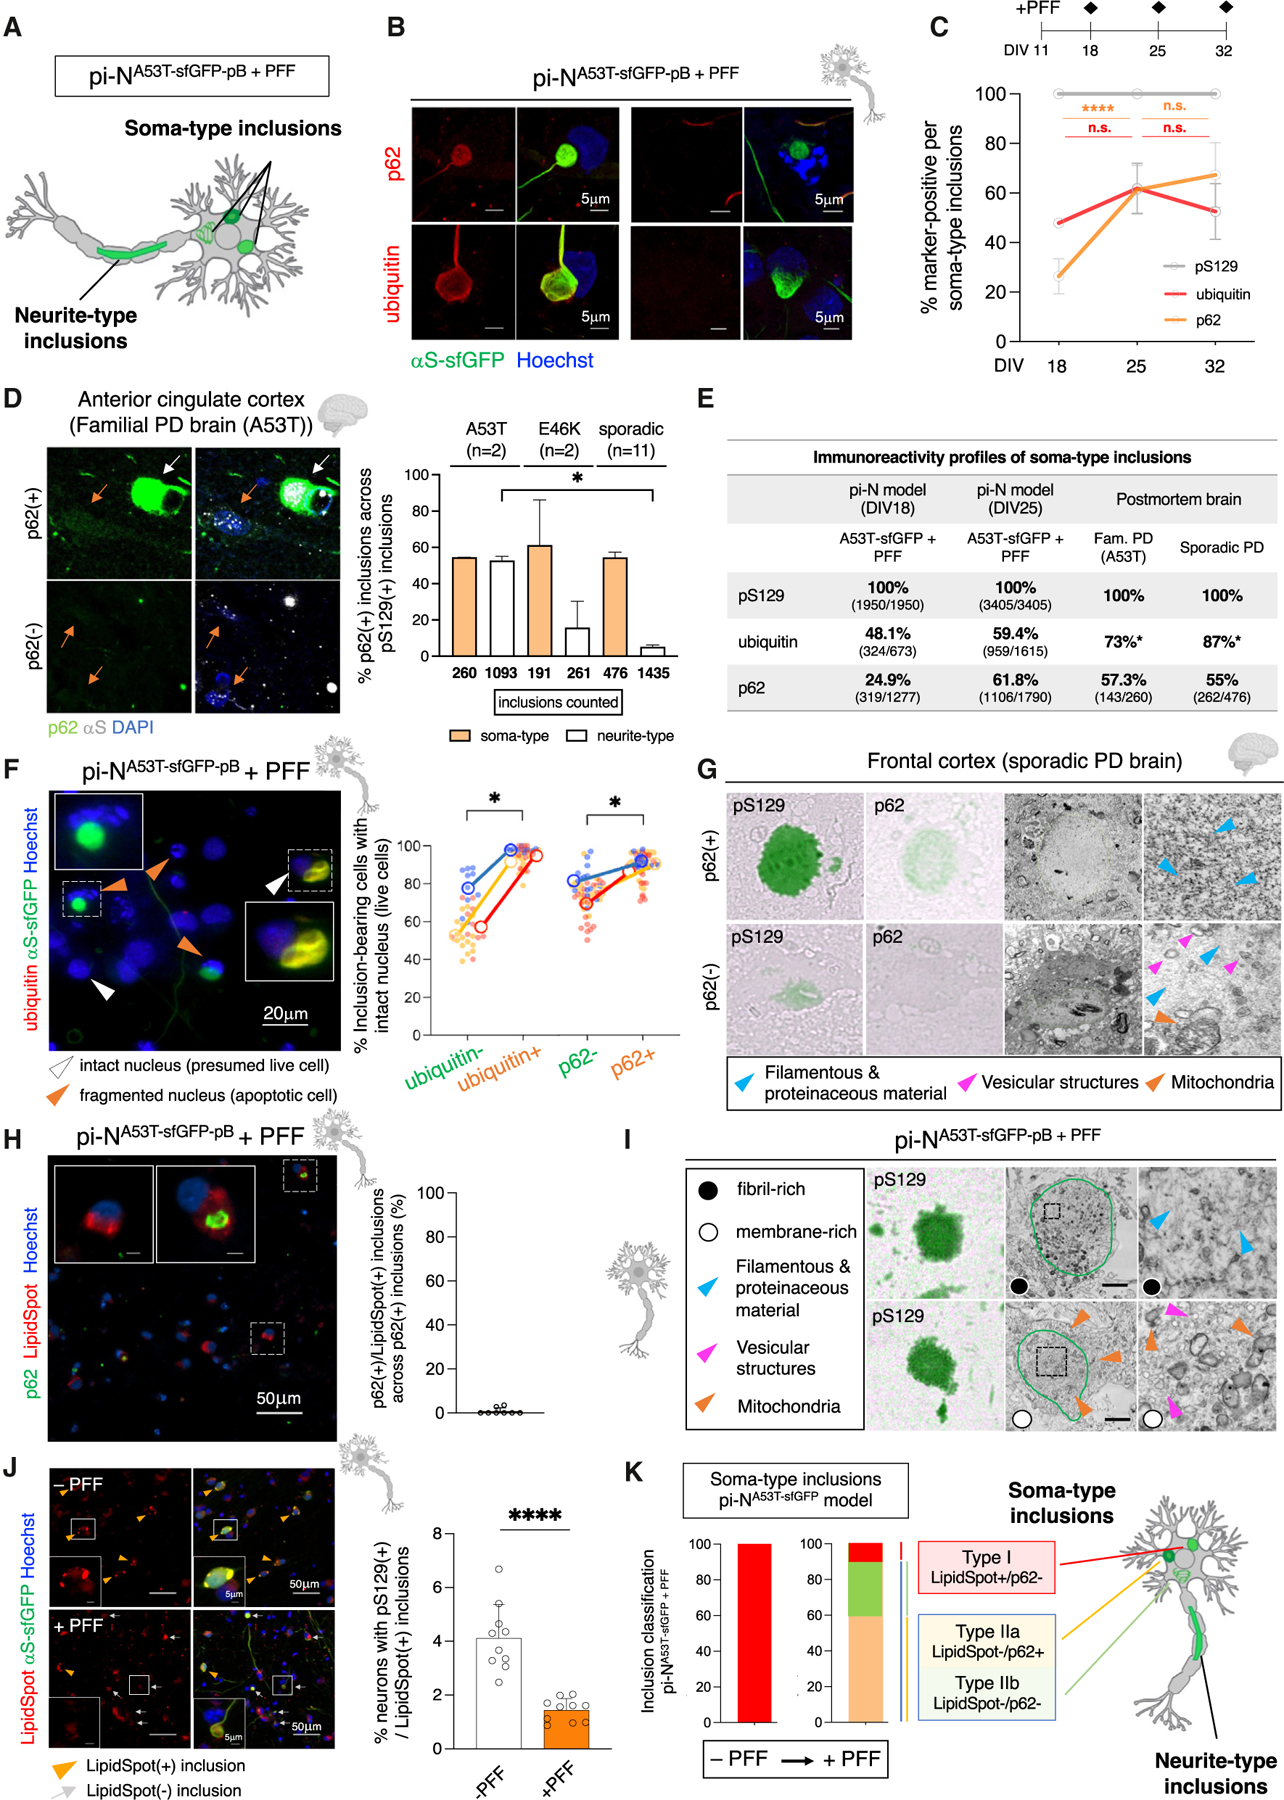
Figure 4. Inclusion classification is conserved from pi-N model to postmortem brain.

(A) Inclusion classification by subcellular location.
(B) Ubiquitin and p62 IF of soma-type inclusions in seeded inclusionopathy model.
(C) Quantification of pS129, p62, and ubiquitin inclusion immunopositivity in seeded pi-Ns. One-way ANOVA plus Tukey’s multiple comparison test: ***p < 0.001, ****p < 0.0001; n.s., not significant.
(D) Left, p62 and αS IF in familial PD brain. Orange arrows, cells with p62(−) inclusions; white arrow, p62(+) inclusion. Right, frequency of p62(+) inclusions in soma and neurites in cingulate cortex of familial PD and sporadic postmortem brains.
(E) Immunoreactivity profiles of soma-type inclusions in pi-N model and postmortem PD brain. *Ratios of ubiquitin(+)/pS129(+) inclusions were inferred from pS129/p62 and p62/ubiquitin double stains. Numbers in parentheses indicate total number of inclusions counted.
(F) Cross-sectional analysis of seeded inclusionopathy model (DIV25) to evaluate association of inclusion p62 and ubiquitin immunopositivity with intact nuclei (presumed live cell) versus fragmented nuclei (presumed dead cell). Paired t test: *p < 0.05.
(G) CLEM for pS129 and p62 in frontal cortex of sporadic PD brain.
(H) IF for p62 and LipidSpot in pi-N model.
(I) CLEM for pS129 in seeded inclusionopathy model.
(J) Left, IF for LipidSpot in pi-NA53T-sfGFP-pB model. Right, quantification of IF. One-way ANOVA plus Tukey’s multiple comparison test: ****p < 0.0001.
(K) Inclusion subtype classification in seeded inclusionopathy model. Type II inclusions data are from (F).
Experimental replicates: 3 (B), 3 (F), 2–3 (H), 3–4 (J), and 2–3 (K, quantification of Type I LipidSpot(+) inclusions) independent replicates each across 3 separate neuronal differentiations. Error bars = SD.
