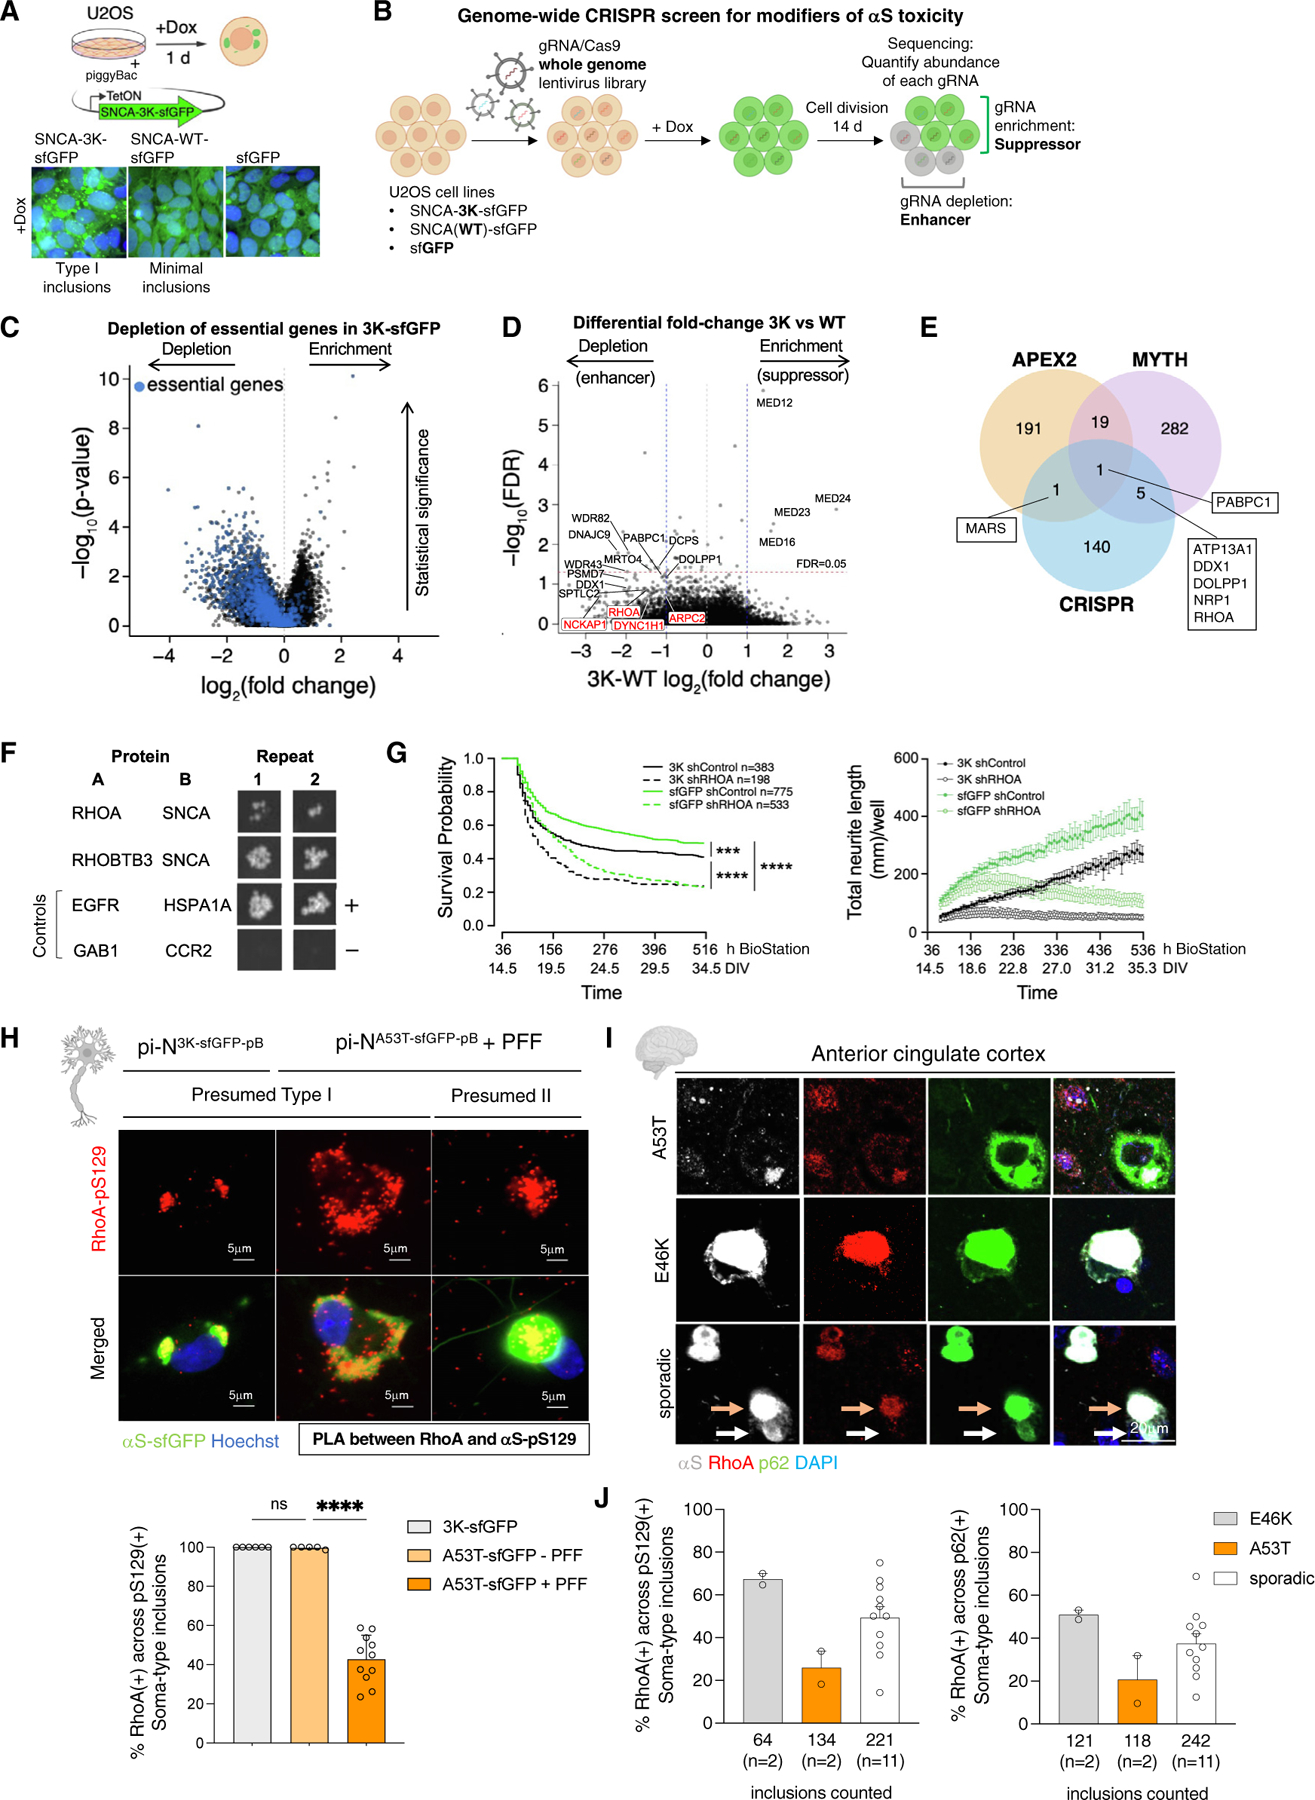
Figure 8. Convergence of CRISPR screen and MYTH on cytoskeleton regulators leads to identification of RhoA(+) inclusions in postmortem brain.

(A) Cartoon of U2OS model harboring pB-SNCA-3K-sfGFP transgene. Micrographs show transgene GFP signal in doxycycline-treated cells.
(B) Genome-wide CRISPR-Cas9 knockout screen for modifiers of αS toxicity.
(C) Volcano plot showing depletion of essential genes (blue).67
(D) Volcano plot comparing fold-change differential between SNCA-3K-sfGFP and SNCA-WT-sfGFP genotypes.
(E) Overlap between spatial (APEX2 and MYTH) and genetic (CRISPR) screen hits.
(F) Interaction of actin cytoskeleton-related proteins RhoA and RhoBTB3 with αS by MYTH.
(G) Left, Kaplan-Meier curve of single-cell survival tracking in pi-N3K-sfGFP-pB and pi-NsfGFP-pB models transduced with shRNA lentivirus. Log rank test: ***p < 0.001, ****p < 0.0001. Data are representative of 2 neuronal differentiations with shRNA lentivirus at MOI20. Right, neurite measurement based on RFP signal.
(H) PLA of RhoA-pS129 in inclusionopathy models. Bottom, quantification of pS129(+) soma-type inclusions from 3 to 4 independent replicates across 3 separate neuronal differentiations. One-way ANOVA plus Tukey’s multiple comparison test: ****p < 0.0001; n.s., not significant.
(I) IF for RhoA, p62, and αS in A53T (n = 2), E46K (n = 2), and sporadic (n = 11) PD brain. Orange arrow, αS(+)/p62(+)/RhoA(+) inclusion; white arrow, αS(+)/p62(+)/RhoA(−) inclusion.
(J) Left, quantification of pS129(+)/RhoA(+) inclusions in PD brain. Right, quantification of (I). Error bars = SD.
