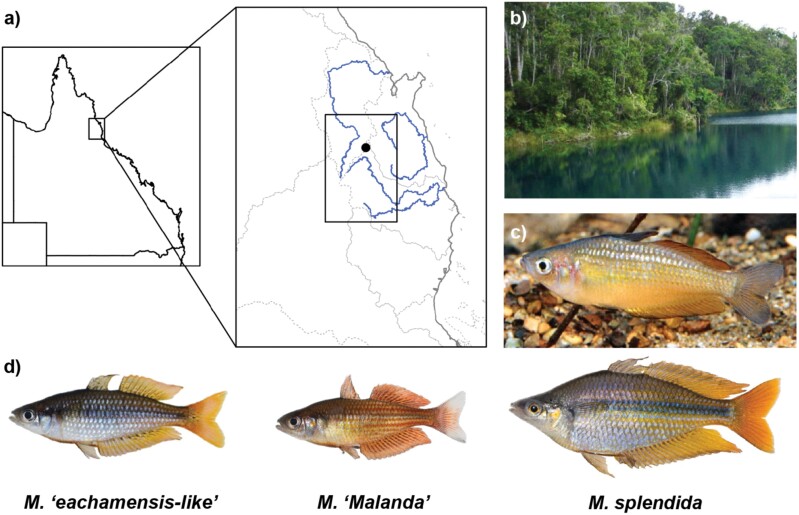
Figure 1.
a) Location of the Tablelands and Lake Eacham within north-east Australia. Study region shown in Fig. 2 corresponds to the inset box. Stronger lines (blue in the online version) show major rivers running through the Tablelands, and are labeled in Fig. 2. Fainter lines represent drainage basin boundaries; b) Lake Eacham (photo: Bruceanthro, Attribution-ShareAlike 3.0 Unported (CC BY-SA 3.0); c) M. eachamensis aquarium lineage (photo: Gunther Schmida); d) the 3 rainbowfish lineages of the Atherton Tablelands (photos: Michael Hammer)

