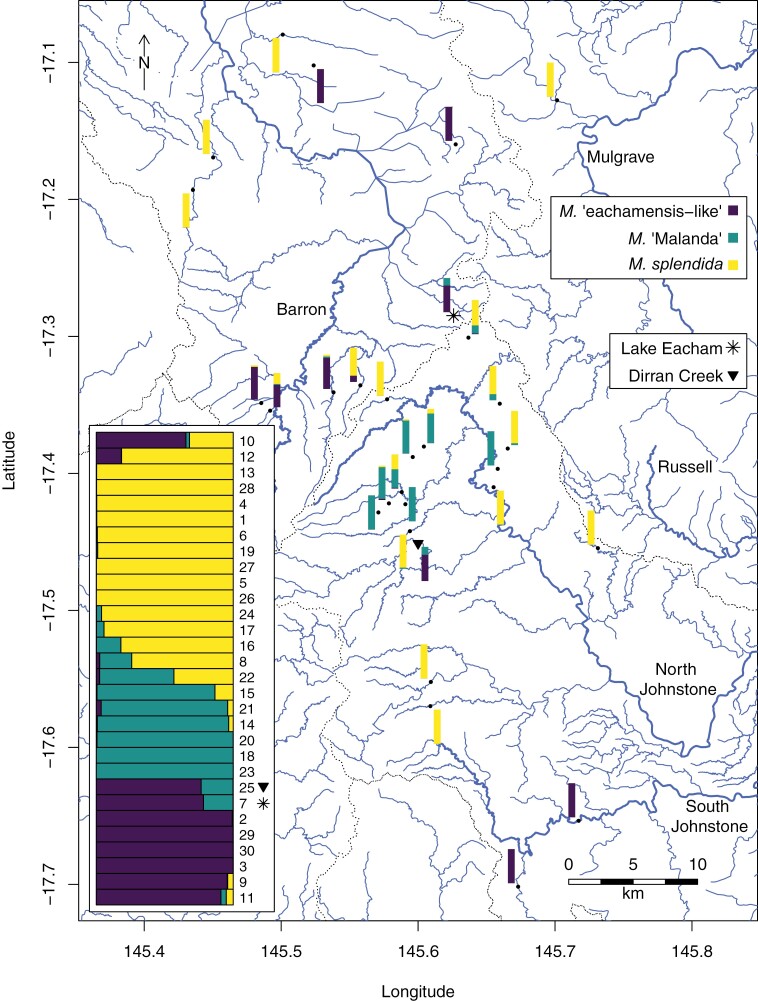
Figure 2.
Map showing sampled locations and admixture proportions of 30 different rainbowfish populations. Major rivers are named and denoted by thicker lines (blue in online version); smaller waterways are denoted by thinner lines. Dotted black lines denote catchment boundaries. The study region corresponds to the inset box in Fig. 1a. A traditional STRUCTURE plot is inset on the bottom left of the figure. Numbers correspond to locality numbers marked in Supplementary File S5.

