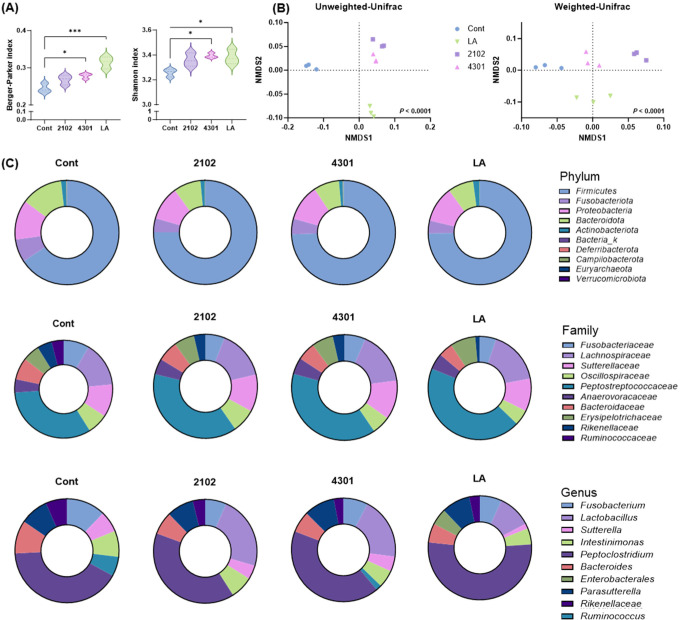
Fig. 2. The diversity and richness of fecal microbiota was altered through FIMM incubation with probiotics.
The metagenomic analysis was utilized to elucidate the alterations in bacterial relative abundance subsequent to FIMM cultivation. Comparative analysis was conducted between FIMM cultivations subjected to probiotic interventions (LA, 2102, and 4301) and a control cohort devoid of any treatment (cont). (A) Indices of alpha diversity and (B) Principal Coordinates Analysis (PCoA) diagrams were constructed to elucidate the spatial distribution of fecal microbiome samples. These diagrams plot individual samples, with axes representing the principal dimensions capturing the maximal variance in microbial community structure across the groups. (C) The comparative representation of bacterial relative abundance at phylum, family, and genus levels across all groups was meticulously quantified. All values are expressed as the mean±SD; significant differences were determined using Student’s t test and ANOVA compared to the cont at * p<0.05 and *** p<0.001. 2102, Enterococcus faecium IDCC 2102; 4301, Bifidobacterium lactis IDCC 4301; LA, Lactobacillus acidophilus SLAM AK001; NMDS, non-metric multidimensional scaling; FIMM, Fermenter for Intestinal Microbiota Model; ANOVA, analysis of variance.

