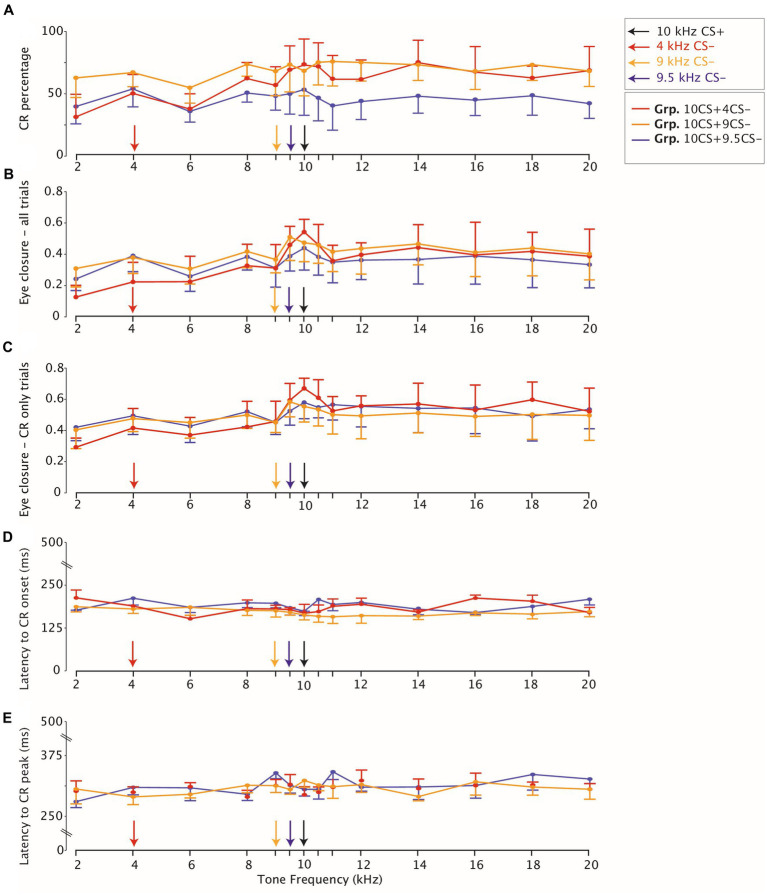
Figure 4.
Eyelid closure testing stimulus generalization peaks for all groups around the trained frequency. (A) Averaged CR percentage in response to non-reinforced CS-only trials. The legend on the right on the top indicates that for each panel on the x-axis the CS- and the CS+ 10kHz are highlighted with arrows. The legend on the right below indicates the color coding for each group. CI at 95% indicates variation across animals for each group. (B) Eyelid closure over all trials (C) same as (B) but eyelid closure computed only over trials which show a CR. (D) Latency to CR onset and (E) Latency to CR peak are stable across tone generalization test frequencies.

