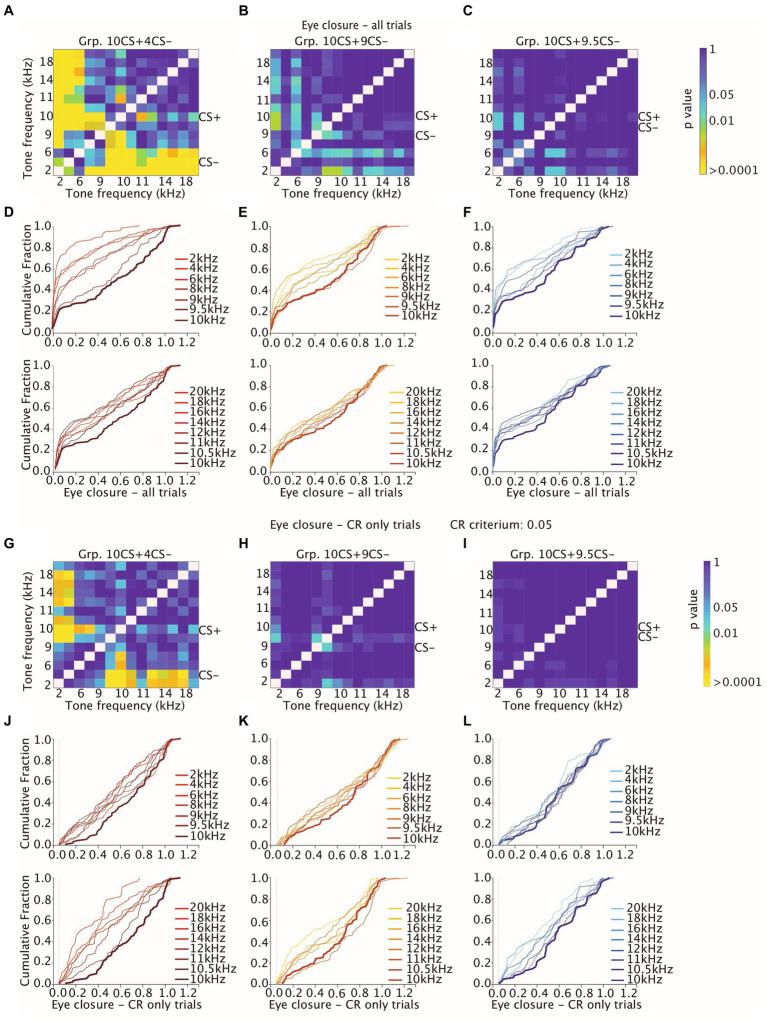
Figure 6.
Heatmaps showing adjusted p-values of all tone-tone comparisons for cumulative distribution functions (CDFs) of amplitude of eyelid closure over all trials and over CR only trials. (A–C) Heatmaps measuring the effect of tone frequency on cumulative distribution of amplitude of eyelid closure over all trials for Grp10CS + 4CS− (left), Grp10CS + 9CS− (center), and Grp10CS + 9.5CS− (right). Color indicates the p-value. Note that the heatmap is on a logarithmic scale. All p-values were calculated using a Kolmogorov–Smirnov test on the cumulative distribution functions (CDFs). All p-values were adjusted for multiple comparisons using a False Discovery Rate (FDR). (D–F) Cumulative distribution function of eyelid closure calculated over all trials for different tone frequencies for each group. Different shades of color per group indicate distance between the CS+ and the other tone frequencies. Generalization stimuli were divided in two separate plots for tone frequencies higher (bottom) and lower (top) than the CS+. The CS+ is illustrated in both top and bottom plot as reference with a thicker line. (G–I) Same as (A–C), but now considering the effect of tone frequency on cumulative distribution of amplitude of eyelid closure over CR only trials (J–L) same as (D–F), but now considering the effect of tone frequency on amplitude of eyelid closure computed over CR only trials. Grp10CS + 4CS− (left), Grp10CS + 9CS− (center), and Grp10CS + 9.5CS− (right). Reference color bar on the right indicates the level of significance for the p-values that are in the figures (0.01, 0.05 and > 0.0001). CR criterium was established at 0.05. For complete statistics we refer to Supplementary Table 5.

