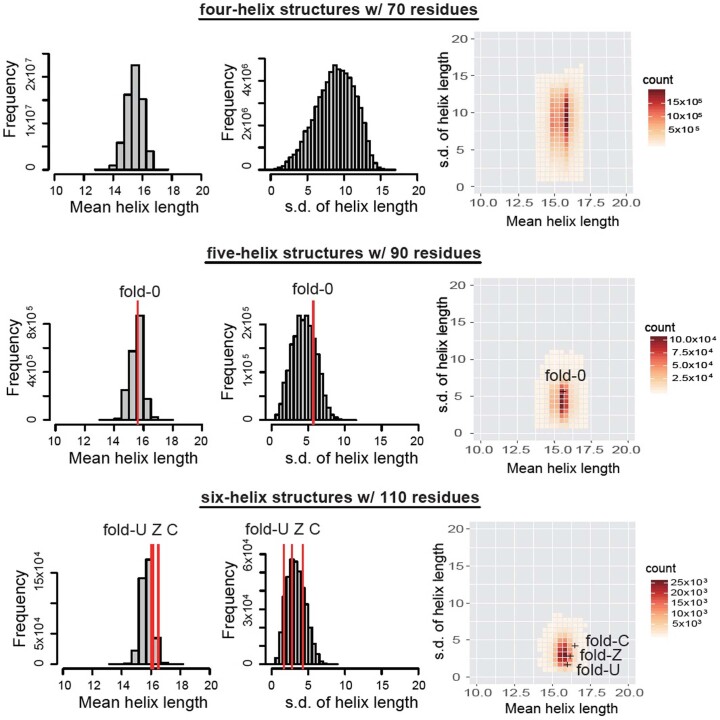
Extended Data Fig. 7. Distribution of the helix lengths for the generated backbone structures with four-helix and 70 residues, five-helix and 90 residues, and six-helix and 110 residues.
Left: The distribution of mean helix lengths for the generated backbone structures. For each backbone structure, the mean helix length was calculated by averaging lengths of the helices in the structure. Middle: The distribution of standard deviation of helix lengths for the generated backbone structures. For each backbone structure, the standard deviation of lengths of the helices in the structure was calculated. Right: The two-dimensional distribution of the mean and standard deviation of helix lengths. The width of the distribution of the standard deviation was in the order of the four-helix, five-helix, and six-helix structures. This is because the four-helix structures were not subject to the Rg constraint, and the five- and six- helix structures were the ones with Rg < 14 Å. Since the same threshold value for the Rg constraint was used, the distribution width for the five-helix structures is slightly wider than that of the six-helix structures. The helix lengths of the designs chosen for experimental characterization correspond to the vicinity of the peaks of the distributions.

