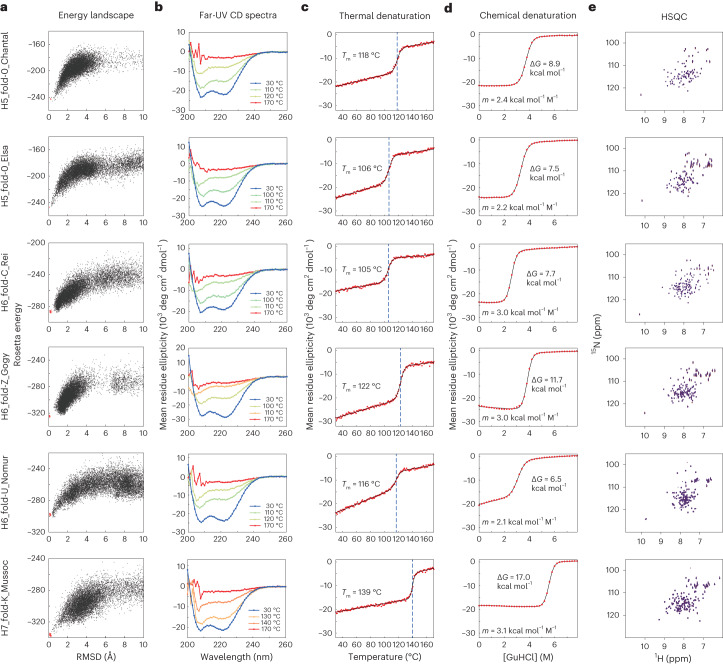
Fig. 5. Characterization of designed proteins.
a, Energy landscapes from Rosetta ab initio structure prediction simulations. The y axis represents Rosetta all-atom energy and the x axis represents the Cα RMSD from the design model. Black points represent the lowest energy structures obtained in independent Monte Carlo structure prediction trajectories starting from an extended chain for each sequence; red points represent the lowest energy structures obtained in trajectories starting from the design model. b, Far-ultraviolet CD spectra at 30 °C, the temperatures close to the melting temperature Tm, and 170 °C. The CD spectra were recorded under the pressure of 10 bar. c, Thermal denaturation measured at 222 nm under the pressure of 10 bar. For each design, the data were fitted to a two-state model (black solid line) to obtain the Tm. d, Chemical denaturation with GuHCl (square brackets denote concentration) measured at 222 nm and 25 °C. For each design, the data were fitted to a two-state model (black solid line) to obtain the free energy of unfolding ΔG and its dependency on the denaturant, m-value. e, Two-dimensional 1H-15N HSQC spectra at 25 °C and 600 MHz.

