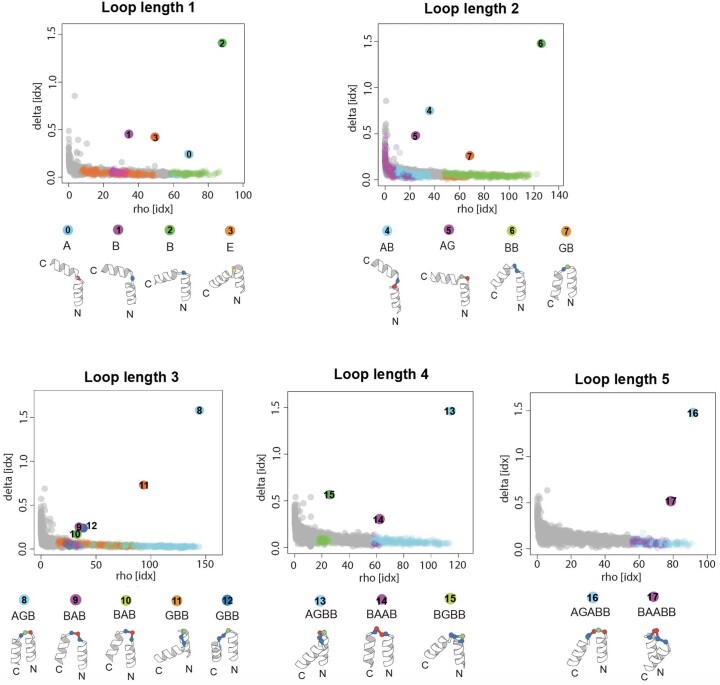
Extended Data Fig. 3. Statistical analysis of HLH motifs of naturally occurring proteins.
HLH structures collected from naturally occurring protein structures were clustered for each loop length from one to five based on the pairwise Euclidean distance between the five-dimensional vectors of the features shown in Extended Data Fig. 2, using the density clustering algorithm30. For each loop length, decision graphs to determine density peaks of clusters are shown, in which rho represents the local density of a point in the five-dimensional feature vector space and delta represents the minimum distance between a point to any other point with higher density; for the point with highest density, delta is calculated as the maximum distance to any other points.

