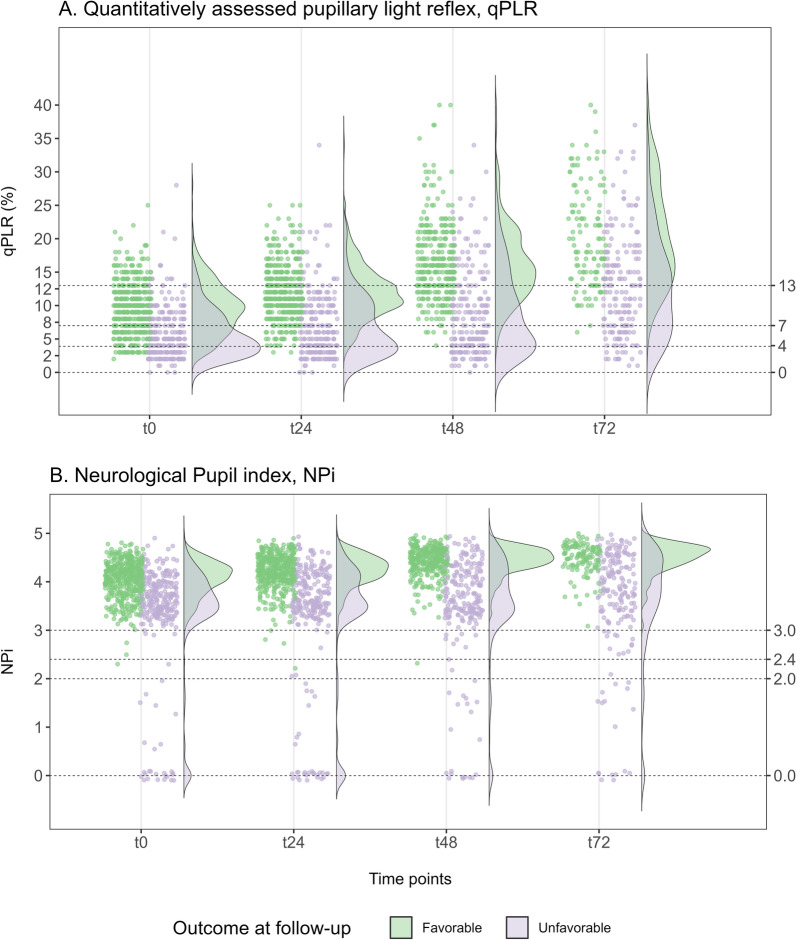
Fig. 1.
Distribution of quantitative pupillometry measurements during the first 72 h (t0–t72) after cardiac arrest according to outcome at follow-up. The rainfall plots show the measurements of qPLR (A) and NPi (B) at time points, with the density and distribution depicted in the violin plot. Measures are divided by primary outcome group, dichotomized as favorable (green) and unfavorable (purple). qPLR quantitatively assessed pupillary light reflex, NPi Neurological Pupil index

