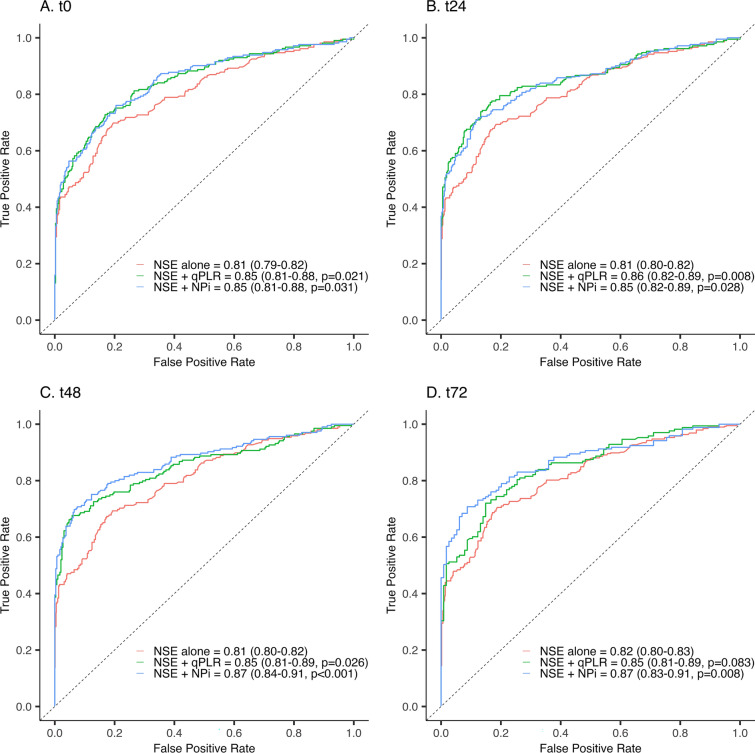
Fig. 2.
Prognostic performance of pupillometry and 48-h NSE. Receiver-operating characteristic curves depicting the prognostic performance by the area under the curve of 48-h plasma neuron-specific enolase level alone and combined with quantitatively assessed pupillary light reflex and Neurological Pupil index, respectively, measured at t0 (A), t24 (B), t48 (C), and t72 (D). The P value depicts the significance of the contribution of pupillometry to neuron-specific enolase in predicting unfavorable outcomes at follow-up. NSE neuron-specific enolase, qPLR quantitatively assessed pupillary light reflex, NPi Neurological Pupil index

