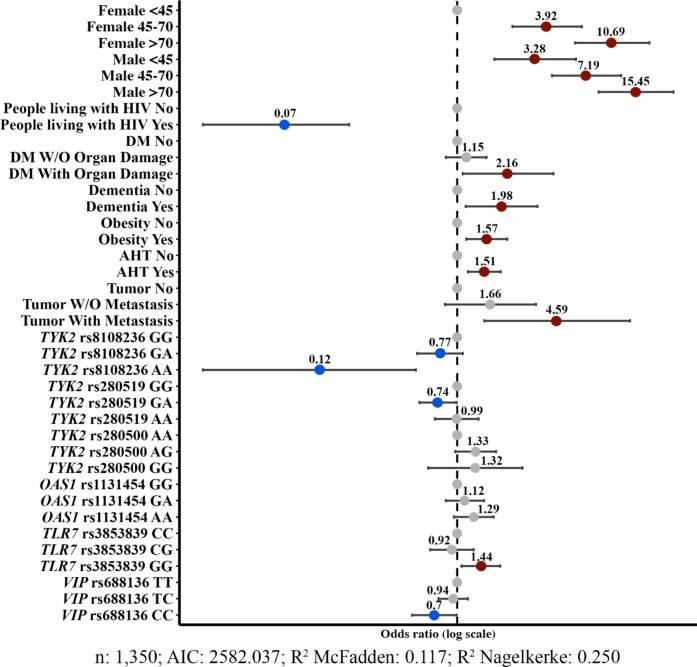
Fig. 2.
Forest plot of the final multivariable model with clinical and genetic variables. The Odds ratios (dots) and 95% confidence intervals (horizontal bars) for all variables are depicted. ORs = 1 correspond to reference conditions and are represented by grey dots, as well as non-significant conditions. Conditions that significantly increase the probability of developing severe COVID-19 are represented by red dots, while those conditions significantly associated with the development of mild COVID-19 are represented in blue (p < 0.05). HIV human immunodeficiency virus, DM Diabetes mellitus, AHT arterial hypertension.

