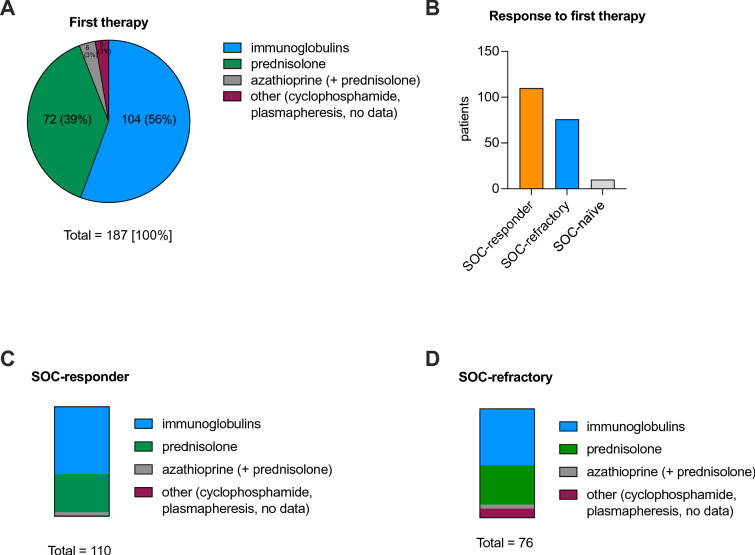
Fig. 4.
Details on first treatment regimen of typical CIDP patients. A First treatment regimen of all patients in % (n = 187). The absolute values are indicated next to their corresponding relative percentages. B Patients’ response to their first therapies according to the SOC criteria are illustrated. C Fractions of the respective treatment regimens in absolute values of all SOC-responder patients (n = 110). D Distribution of the respective treatment regimens in absolute values of all SOC-refractory patients (n = 76). CIDP chronic inflammatory demyelinating polyneuropathy, SOC standard of care

