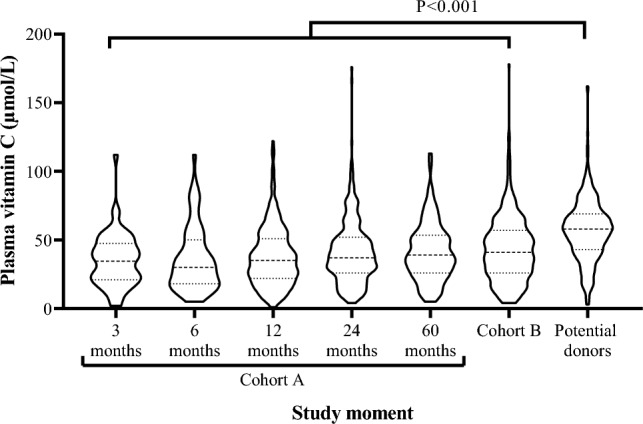
Fig. 1.

Vitamin C concentration in KTR. Dashed and dotted lines represent the median and first and third quartile, respectively, and the width of the sections represent the probability that members of the population will take that given value. The median (IQR) plasma vitamin C concentration was 35 (21–48), 30 (18–50), 35 (22–51), 37 (26–52), 39 (26–54), 41 (26–57), and 58 (43–69) µmol/L at 3, 6-, 12-, 24- and 60-month post-transplantation, among prevalent KTR of cohort B and among potential donors, respectively
