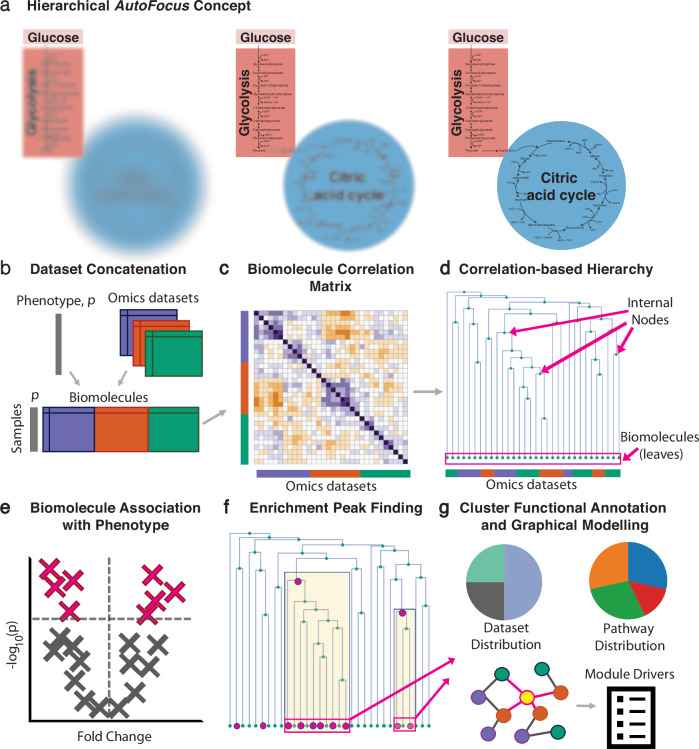
Fig. 1. AutoFocus method overview.
a Conceptual depiction of applying “focus” to the biological process of carbon metabolism at different hierarchical levels. b Multiple molecular datasets with biomolecules from the same n samples are concatenated into a single matrix, accompanied by sample phenotype information, p. c Correlation coefficients between molecules are calculated to generate a correlation matrix, d Correlation coefficients are converted to distances to create a hierarchical tree of biomolecules, e Biomolecules are univariately correlated with the phenotype of interest and filtered for statistical significance, f Enrichment “peaks” are detected by performing an enrichment analysis of the “leaves” descending from each internal node, i.e., the number of significantly correlated molecules in the respective cluster. g Functional annotation and module driver analysis is performed on each enriched module.

