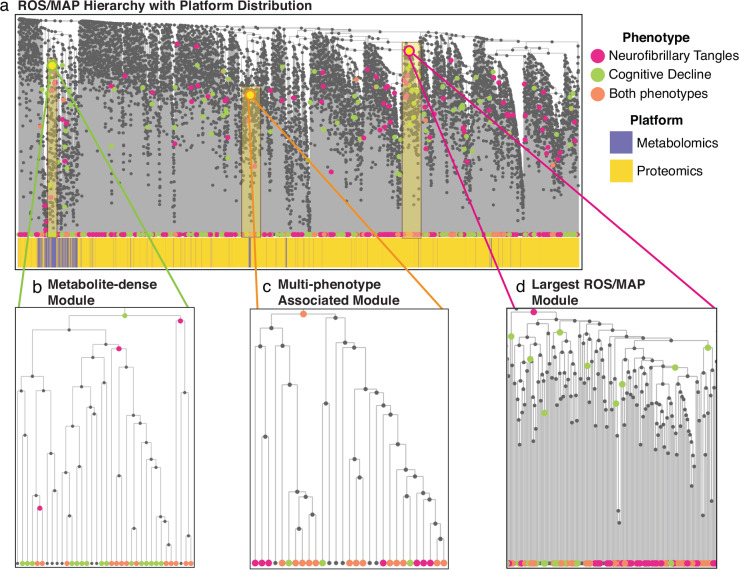
Fig. 4. Results of running the AutoFocus method on the ROS/MAP dataset.
The dataset included a total of 500 samples, which contained 8193 biomolecules from a metabolomics platform a proteomics platform performed on post-mortem brain tissue. a View of the full hierarchical structure created from the ROS/MAP dataset with two phenotypes annotated and dataset distribution below. Magenta circles represent the neurofibrillary tangles phenotype, green circles represent cognitive decline, and orange circles are overlaps between the two. Significant molecules are dispersed densely throughout the tree and enriched modules are scattered throughout the hierarchy at a large range of heights. b Zoomed-in view of a metabolomics module enriched for significant hits associated with cognitive decline. This module contained metabolites related to oxidative stress and lipid peroxidation. c Zoomed in view of the largest module found in the dataset which was enriched for metabolites and proteins significantly associated with neurofibrillary tangles. d Zoomed-in view of the largest module enriched for both phenotypes with the left sub-tree (yellow) enriched for mitochondrial proteins and the right sub-tree (pink) enriched for proteins related to synaptic vesicle exocytosis and inhibitory neurotransmission.

