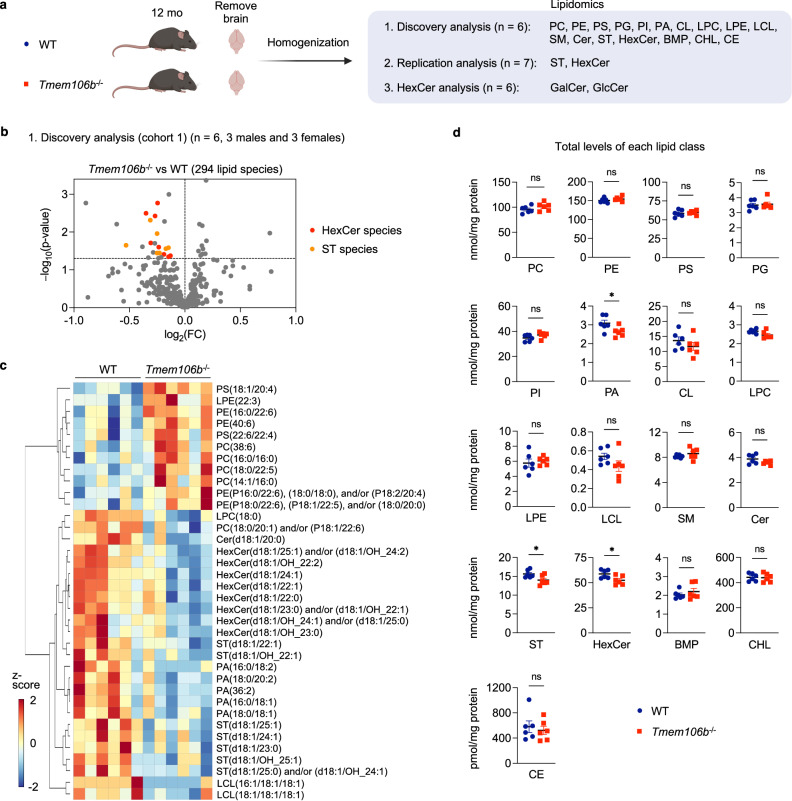
Fig. 1. Hexosylceramide and sulfatide are decreased in TMEM106B-decifient brains.
a Diagram showing the experimental procedures of lipidomic analysis using the brain of 12-month-old WT and Tmem106b−/− mice. First, targeted shotgun lipidomics were performed using 6 mice per genotype (cohort 1) to analyze 17 general lipid classes; phosphatidylcholine (PC), phosphatidylethanolamine (PE), phosphatidylserine (PS), phosphatidylglycerol (PG), phosphatidylinositol (PI), phosphatidic acid (PA), cardiolipin (CL), lyso-phosphatidylcholine (LPC), lyso-phosphatidylethanolamine (LPE), lyso-cardiolipin (LCL), sphingomyelin (SM), ceramide (Cer), sulfatide (ST), hexosylceramide (HexCer), free cholesterol (CHL), cholesterol esters (CE), bis(monoacylglycerol)phosphate (BMP). The total number of lipid species analyzed in this study is 294. Second, ST and HexCer levels were analyzed using another cohort with 7 mice per genotype (cohort 2) to test replicability. Finally, SFC-MS/MS was performed using cohort 1 to analyze galactosylceramide (GalCer) and glucosylceramide (GlcCer) species separately. The diagram was created with BioRender.com. b Volcano plot of discovery analysis with cohort 1 showing all 294 molecular lipid species. n = 6 (3 males and 3 females) per genotype. HexCer and ST species (p < 0.05) are highlighted in red and orange, respectively. The horizontal line indicates p = 0.05. p Values were calculated using two-tailed unpaired t-test. c Heatmap of all lipid species significantly affected by TMEM106B deficiency at p < 0.05 cutoff. d Scatter plots of the sum of all species within a lipid class for each class in WT versus Tmem106b−/−. Mean ± SEM, n = 6 (3 males and 3 females) per genotype. *p = 0.0411 (PA), *p = 0.0311 (ST), *p = 0.0279 (HexCer); two-tailed unpaired t-test.

