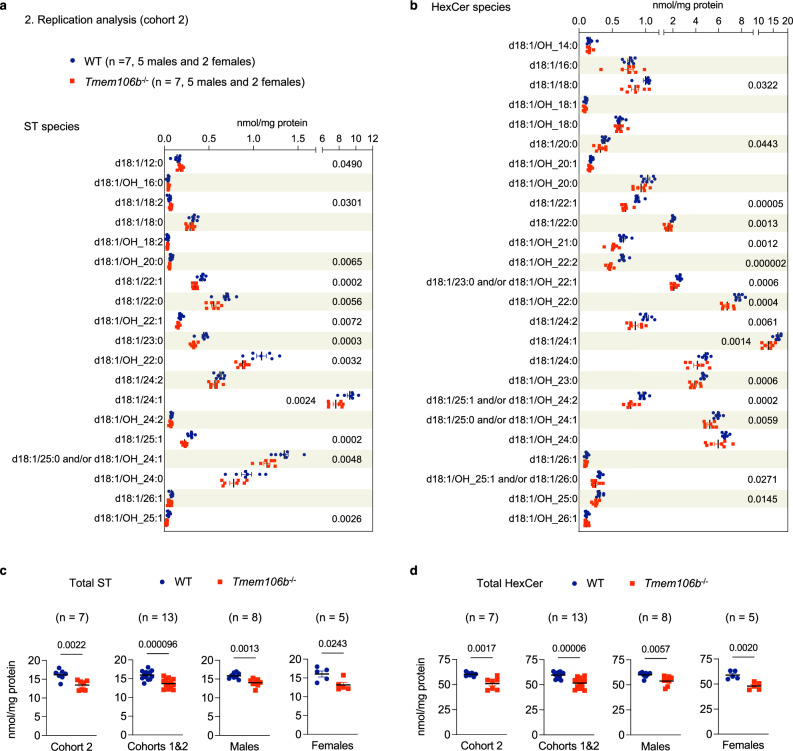
Fig. 2. A decrease in HexCer and ST is also observed in another cohort of TMEM106B-deficient brains.
a Levels of ST species in the brain of WT and Tmem106b−/− mice (cohort 2) at 12 months of age. Mean ± SEM, n = 7 mice (5 males and 2 females) per genotype. p-Values were determined using two-tailed unpaired t-test and shown on the right side of the graph when p < 0.05. b Levels of HexCer species in the brain of WT and Tmem106b−/− mice (cohort 2) at 12 months of age. Mean ± SEM, n = 7 mice (5 males and 2 females) per genotype. p-Values were determined using two-tailed unpaired t-test and shown on the right side of the graph when p < 0.05. c Total ST levels (sum of all species) in the brain of WT and Tmem106b−/− mice at 12 months of age. Mean ± SEM. Cohorts 1 and 2 are from the discovery and replication analyses, respectively. p-Values were determined using two-tailed unpaired t-test and were shown on the top of the graphs. d Total HexCer levels (sum of all species) in the brain of WT and Tmem106b−/− mice at 12 months of age. Mean ± SEM. Cohorts 1 and 2 are from the discovery and replication analyses, respectively. p-Values were determined using two-tailed unpaired t-test and were shown on the top of the graphs.

