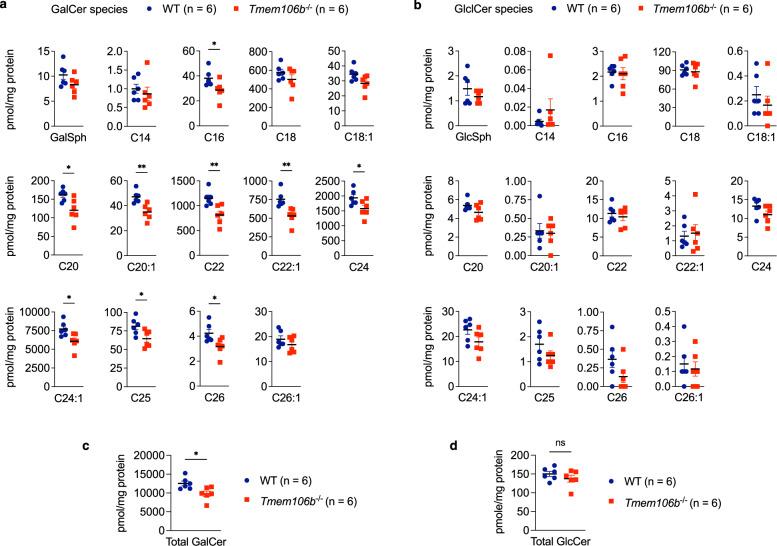
Fig. 3. GalCer but not GlcCer is decreased in TMEM106B-deficient brains.
a Levels of GalCer species in the brain of WT and Tmem106b−/− mice at 12 months of age. Mean ± SEM, n = 6 mice (3 males and 3 females) per genotype. *p = 0.0396 (C16-GalCer), *p = 0.015 (C20-GalCer), **p = 0.0034 (C20:1-GalCer), **p = 0.0073 (C22-GalCer), **p = 0.005 (C22:1-GalCer), *p = 0.0423 (C24-GalCer), *p = 0.0203 (C24:1-GalCer), *p = 0.0285 (C25-GalCer), *p = 0.0298 (C26-GalCer); Two-tailed unpaired t-test. b Levels of GlcCer species in the brain of WT and Tmem106b−/− mice at 12 months of age. Mean ± SEM, n = 6 mice (3 males and 3 females) per genotype. None of the species were significantly affected by two-tailed unpaired t-test. c Total GalCer levels (sum of all species) in the brain of WT and Tmem106b−/− mice at 12 months of age. Mean ± SEM, n = 6 mice (3 males and 3 females) per genotype. *p = 0.0188; two-tailed unpaired t-test. d Total GlcCer levels (sum of all species) in the brain of WT and Tmem106b−/− mice at 12 months of age. Mean ± SEM, n = 6 mice (3 males and 3 females) per genotype. Two genotypes were not significantly different by two-tailed unpaired t-test.

