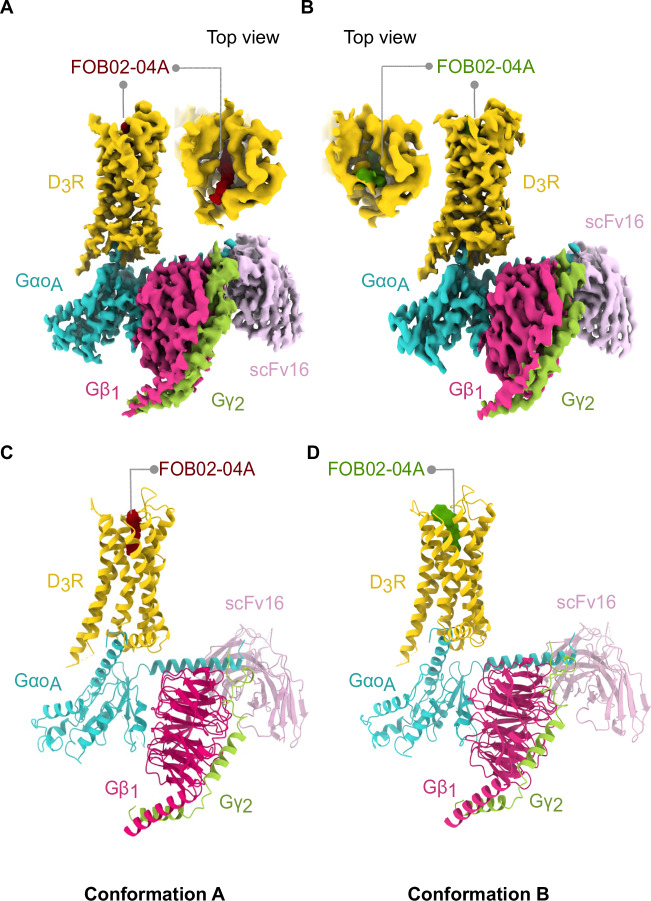
Fig. 1. Overall cryo-EM reconstruction of the D3R-GO:FOB02-04A complex.
A, B Cryo-EM maps for the D3R-GOA:FOB02-04A complex in Conformation A (A) and B (B) are shown with an inset into the ligand binding site from the top view. Cryo-EM density is colored according to subunit with the bitopic ligand colored in red (Conformation A) and green (Conformation B). C, D Coordinates for Conformation A (C) and B (D) for both complexes are shown as cartoons and colored by subunit with the bitopic ligand colored in red (Conformation A) and green (Conformation B).

