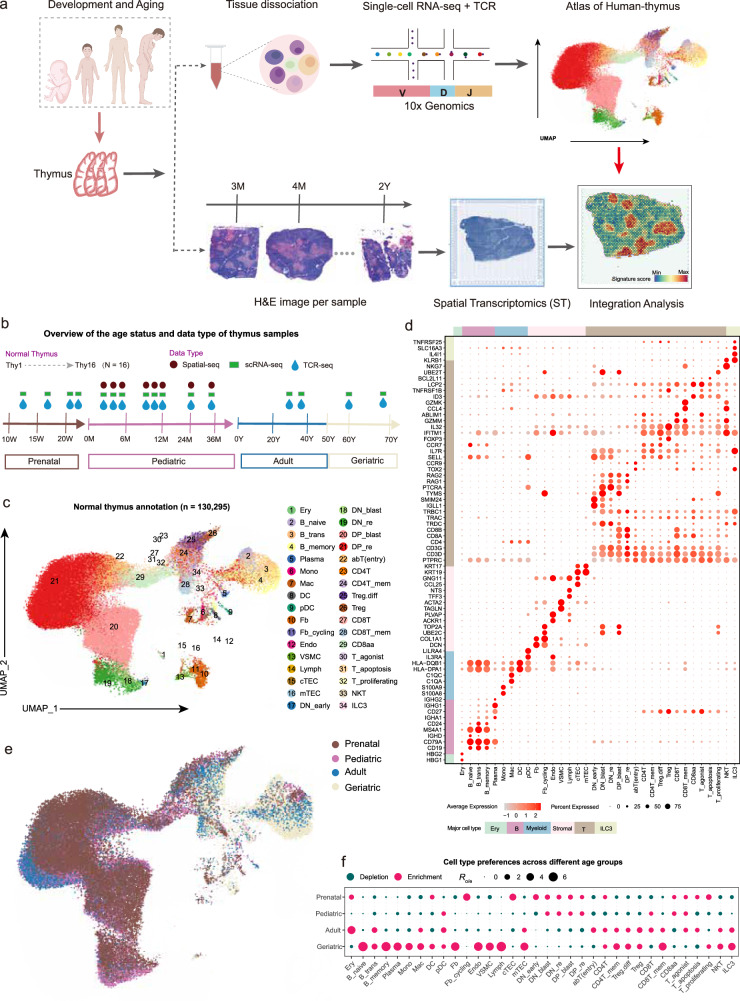
Fig. 1. Generation of a transcriptional atlas of human thymus development at different age groups.
a Schematic representation of the study design. b Summary of normal thymus samples. Different shapes and colors represent data types, and arrows indicate the transition from prenatal to geriatric stages. c Two-dimensional uniform manifold approximation and projection (UMAP) of single cells collected from normal thymus samples. Annotated cell types are color-coded. d Dot plot showing marker gene expression used for cellular annotation. The size of the dots indicates the proportion of that marker expressed in a particular cell type and the color indicates the average expression level. The annotation bars on the left and top indicate broad cell subsets, with the corresponding color codes. e UMAP colored by age groups, including prenatal, pediatric, adult, and geriatric groups. f Age group preference of each cell type was measured by the ratio (Ro/e)21 of the observed number of cells to the expected number of cells at random (i.e., with no association between subsets and ages, allowing observation of the expected number of cells). Figure 1a created with BioRender.com released under a Creative Commons Attribution-NonCommercial-NoDerivs 4.0 International license. Source data are provided as a Source Data file.

