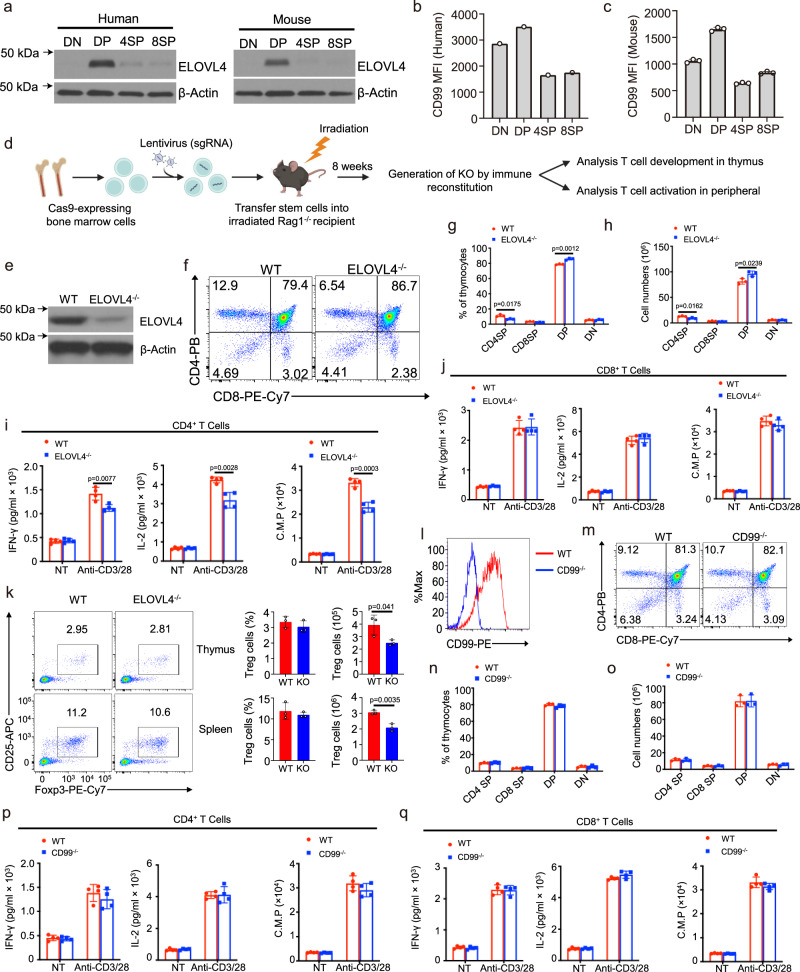
Fig. 4. Using CRISPR/Cas9-mediated knockout to investigate cortical region-enriched genes in thymus development.
a Immunoblot analysis of the ELOVL4 proteins using mouse and human thymocytes at different stages as indicated. b, c Flow cytometric analysis of CD99 expression using median fluorescence intensity (MFI) on gated thymocytes as indicated. Summary graphs are presented as mean ± SD. P values were determined by an unpaired two-tailed Student’s t test. d Schematic of Lentiviral CRISPR/Cas9-Mediated knockout using bone marrow chimeric mice. e Immunoblot analysis of ELOVL4 proteins using naïve T cells from CRISPR/Cas9-Mediated ELOVL4 knockout and control mice. f–h Flow cytometric analysis of thymocyte subpopulations showing a representative FACS plot (left) and summary graph (right) of total thymocyte numbers and frequency of indicated subpopulations (n = 3 biological replicates). i, j ELISA analyzes of IFN-γ and IL-2 expression using supernatants collected from naïve CD4+ T cells and naïve CD8+ T cells purified from splenocytes of CRISPR/Cas9-Mediated ELOVL4 knockout and control mice (n = 4 biological replicates), stimulated for 48 hours with plate-bound anti-CD3 plus anti-CD28 antibodies. T-cell proliferation assays were measured after 40 hours by pulse-labeling the stimulated T cells with [3H] thymidine for 8 hours. k Flow cytometric analysis of Treg cells (CD4+CD25+Foxp3+) showing a representative FACS plot (left) and summary graph (right) of absolute numbers and frequency (n = 3 biological replicates). (l) Flow cytometric analysis of the surface expression of CD99 on splenocyte T cells within the indicated group. m–o Flow cytometric analysis of thymocyte subpopulations showing a representative FACS plot (left) and summary graph (right) of total thymocyte numbers and frequency of indicated subpopulations. p, q ELISA analyzes of interferon-gamma (IFN-γ) and IL-2 expression using supernatants collected from naïve CD4+ T cells (CD4+CD44loCD62Lhi) and naïve CD8+ T cells (CD8+CD44loCD62Lhi) purified from splenocytes of CRISPR/Cas9-Mediated CD99 knockout and control mice (n = 4 biological replicates), stimulated for 48 hours with plate-bound anti-CD3 plus anti-CD28 antibodies. T-cell proliferation assays were measured after 40 h by pulse-labeling the stimulated T cells with [3H] thymidine for 8 hours. 8-week-old female mice were used for experiment. Figure 4d created with BioRender.com released under a Creative Commons Attribution-NonCommercial-NoDerivs 4.0 International license. ELISA: Enzyme-Linked immunosorbent assay, FACS: Fluorescence-Activated cell sorting. Source data are provided as a Source Data file.

