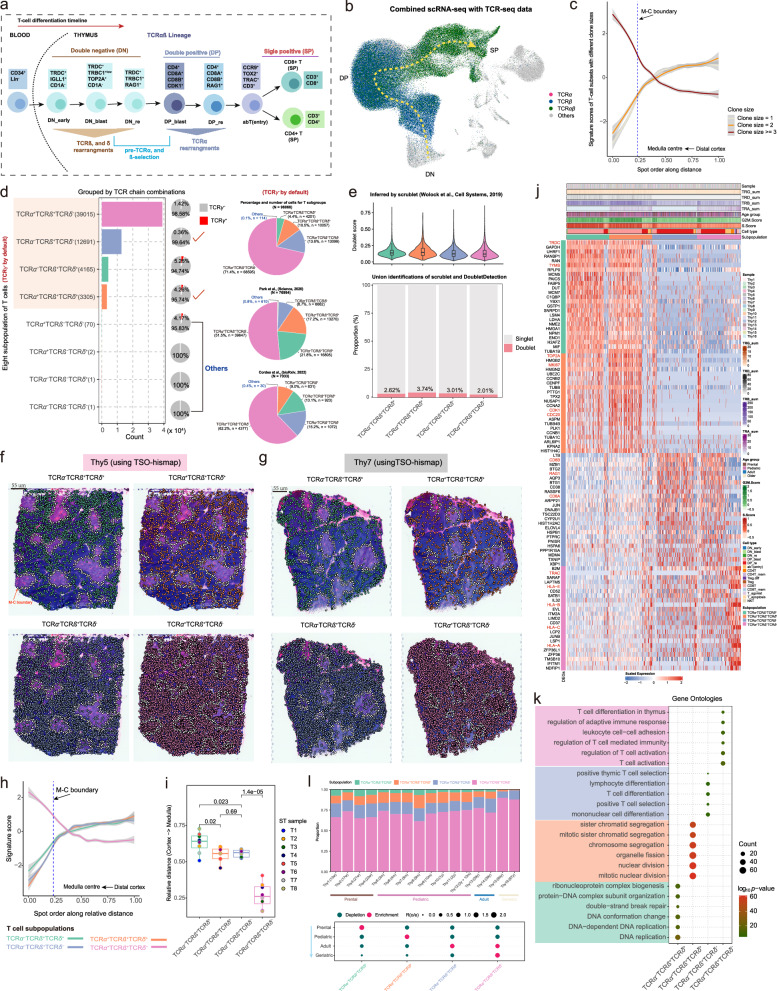
Fig. 7. Spatio-temporal dynamics of four T-cell subpopulations.
a Schematic representation of human T cell development. b Uniform Manifold Approximation and Projection (UMAP) plot showing the cells with rearranged T-cell receptor α (TCRα) (purple), TCRβ (dark blue), or fully rearranged TCRαβ (dark green). c TSO-his applied to eight thymus spatial transcriptomics (ST) slides showing the variation in clone size with spatial distance. Lines smoothed using generalized linear models, with shaded areas representing 95% confidence intervals. The blue dashed line represents the Medulla-Cortex (M-C) boundary. T cells with larger clone sizes are more enriched in the medullary region. d T-cell subpopulations generated using four TCR chains (see “Methods”). Due to significant under-representation (almost below 5%) of the TCRγ+ subpopulation, only the TCRγ- T-cell subpopulations are presented. The bar plot showing counts for TCRα-TCRβ+TCRδ+, TCRα+TCRβ+TCRδ+, TCRα-TCRβ+TCRδ- and TCRα+TCRβ+TCRδ- subpopulations. The pie charts on the right show the relative abundance of these subpopulations in the datasets of this study (top), Park et al. 8 (middle) and Cordes et al. 33 (bottom); “Others” include the TCRα+TCRβ-TCRδ-, TCRα-TCRβ-TCRδ-, TCRα+TCRβ-TCRδ+ and TCRα-TCRβ-TCRδ+ populations. e Violin combined with box plot showing the distribution of doublet scores inferred by Scrublet45 for four T-cell subpopulations. Median value, interquartile range (IQR) as bounds of the box and whiskers that extend from the box to upper/lower quartile ± IQR × 1.5 (top). Stacked bar plot showing the proportions of doublet and singlet cells inferred by Scrublet and DoubletDetection46 within each T cell subpopulation (bottom). Subpopulations: TCRα-TCRβ+TCRδ+ (n = 4,165 cells), TCRα+TCRβ+TCRδ+ (n = 3305 cells), TCRα-TCRβ+TCRδ- (n = 12,691 cells), and TCRα+TCRβ+TCRδ- (n = 39,015 cells). f, g Projection of the four T cell subpopulations onto ST slices using TSO-hismap for Thy5 (f) and Thy7 (g). Each dot represents a T cell and the white dotted line indicates the M-C boundary. h Spatial-distance applied to eight thymus ST slides, showing the trend of signature scores for the four T-cell subpopulations from the distal cortex to medullary center spots. Lines smoothed using generalized linear models, with shaded areas representing 95% confidence intervals. The blue dashed line represents the M-C boundary. i Box plot showing the distances of the four T-cell subpopulations relative to the medullary center. Each dot indicates an ST sample. Median value, interquartile range (IQR) as bounds of the box and whiskers that extend from the box to upper/lower quartile ± IQR × 1.5. The two-sided t-test was used for statistical analysis. j Heatmap showing the top 25 significantly upregulated genes in each T cell subpopulation (FDR ≤ 0.01 and logFC ≥ 0.25). Representative genes in each subpopulation are marked in red. T cells within each subgroup are arranged in chronological order of differentiation. k Dot plot showing the six most significantly enriched biological processes terms (by log10(p-value)) for each subgroup established in Fig. 7j. P-values were obtained using Fisher’s exact test and adjusted by the Benjamini-Hochberg method. (l) Top panel: Stacked bar plot showing the relative proportions of the four T cell subpopulations in each thymus sample, marked by color codes. Bottom panel: Age group preference of T cell subpopulation measured by Ro/e21. TCRα-TCRβ+TCRδ+ and TCRα+TCRβ+TCRδ+ are enriched in the younger group, while TCRα-TCRβ+TCRδ- and TCRα+TCRβ+TCRδ- are more prevalent in the geriatric group. Source data are provided as a Source Data file.

