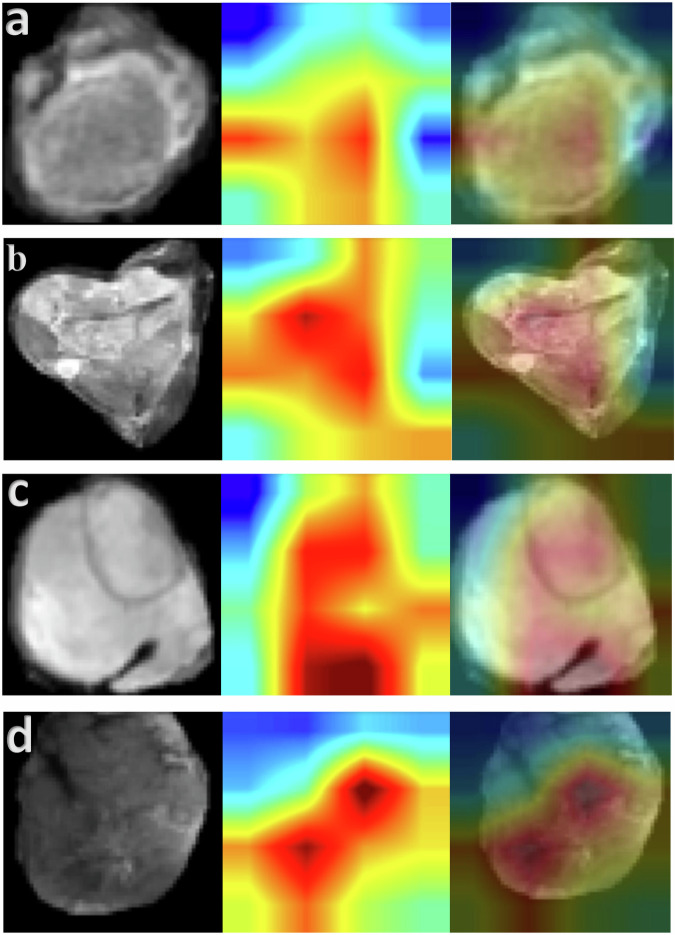
Fig. 3. Heat maps using the GradCAM method on our test set.
Representative T2 fat sat axial slices of four test set patients in our study (patients which were never encountered during model training) are displayed. The corresponding heat map from the same patient was pulled from the image subnetwork of the MMNN model. The merged image is provided. In all cases, the model deemed pixels within the tumor volume as most relevant. a Patient predicted to have very low risk of death and metastases, survived with no development of metastases over a 10-year follow-up period. (Low predicted risk, model correct). b Patient predicted to have high risk of death and metastases, perished shortly after developing metastases 1.2 years after surgery. (High predicted risk, model correct). c Patient predicted to have high risk of metastases, did not develop metastases in 3.8 years of follow-up (High predicted risk, model wrong). d Among patients who developed metastases in our test set, this patient had the lowest predicted risk. The model was correct in all other predictions indicating a lower risk of distant metastases. (Low-intermediate predicted risk, model incorrect since patient developed metastases two years after surgery).

