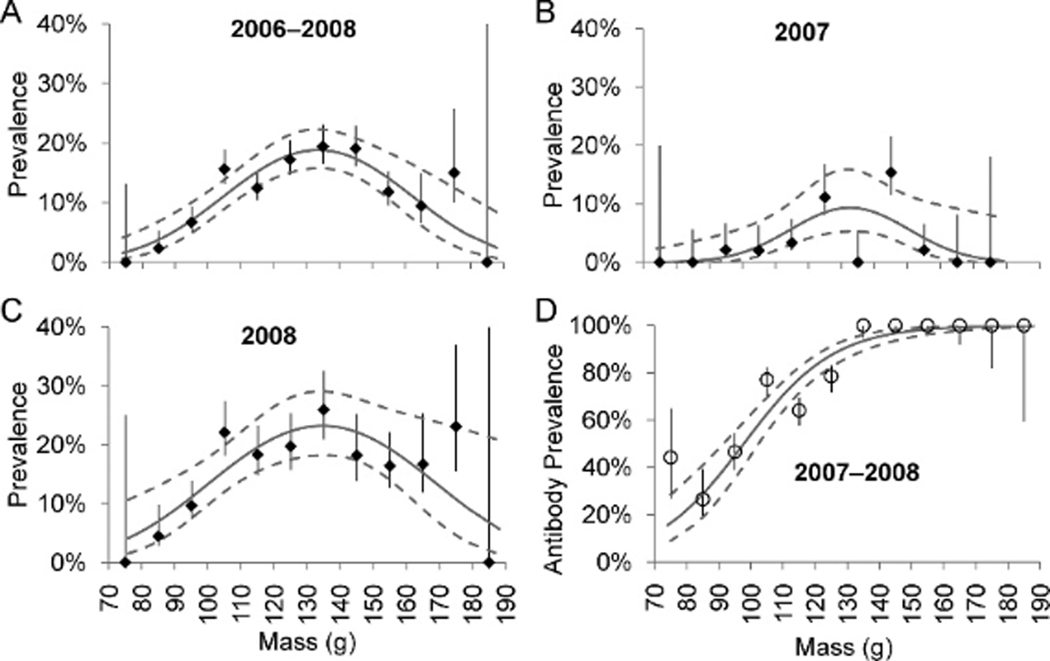
Figure 2.
Avian influenza virus prevalence during (A) 2006–2008, (B) 2007, and (C) 2008, and (D) antibody prevalence during 2007–2008 in Ruddy Turnstones by 10-g mass classes, Delaware Bay. Lines of fit and 95% confidence interval are shown (all fits are significant at α=0.01). Also shown are prevalences and adjusted antibody prevalences (±SE) positioned at the midpoint of each class (e.g., adjusted antibody prevalence among birds 90–99 g is plotted at 95 g).

