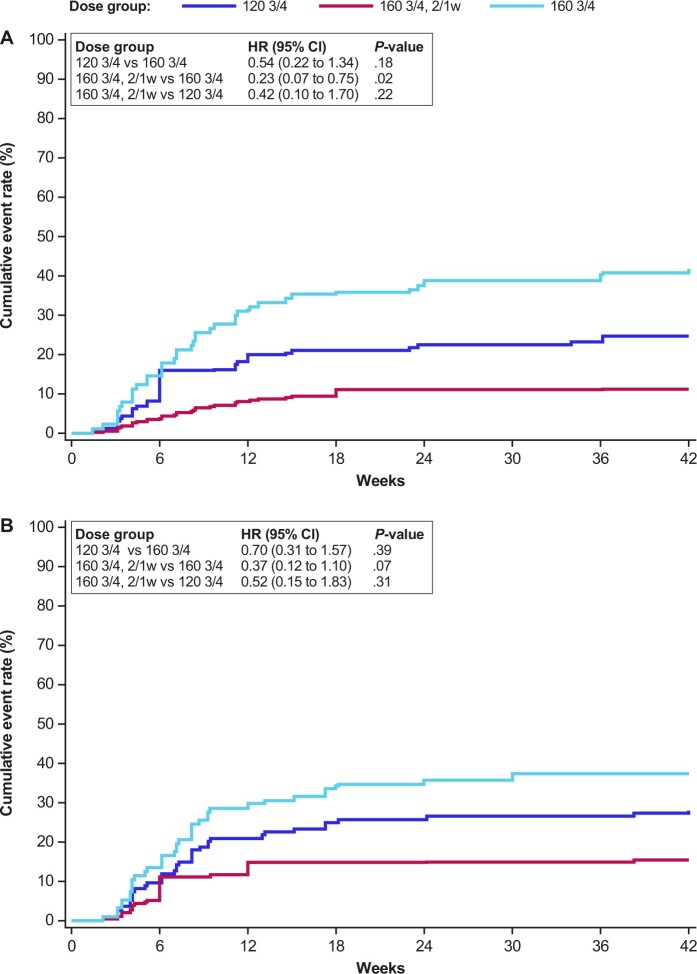
Figure 1.
Cumulative incidence of grade 3 anemia and dose reductions over time. A) Treatment-related grade 3 anemia according to dose and schedule. B) Dose reductions due to treatment-emergent adverse events according to dose and schedule. HR and P-values presented here were not adjusted for other factors. 2/1w = 2 weeks on, 1 week off; 120 3/4 =120 mg QD 3 days on, 4 days off; 160 3/4 = 160 mg QD 3 days on, 4 days off; CI = confidence interval; HR = hazard ratio; QD = once daily.

