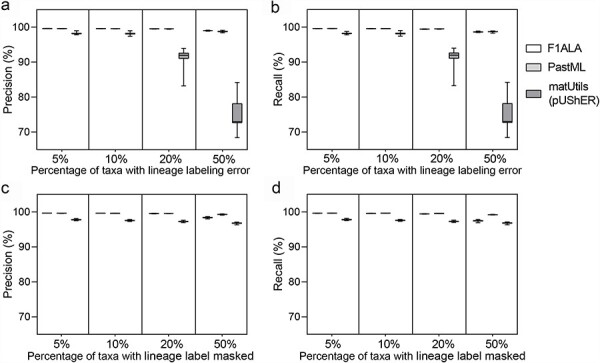
Figure 3.

Accuracy of ALA for the datasets with simulated errors. (a) Precision and (b) recall when introducing PANGO lineages labeling errors to 5%, 10%, 20%, and 50% of taxa in the tree (100 replicates). (c) Precision and (d) recall when lineage labels were masked for 5%, 10%, 20%, and 50% of taxa in the tree (100 replicates). Paired t-tests were statistically significant (P-value < 0.05) for all pair-wise comparisons among F1ALA, PastML, and matUtils (pUShER). The whiskers represent the minimum and maximum values while the box shows the lower and upper quartiles with the median crossing the box.
