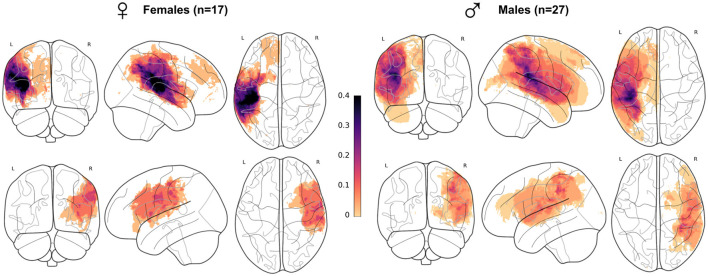
Figure 1.
Lesion mapping per sex subgroup in the whole patient cohort. Superposition of all patient's lesion masks per sex and lesion side (females lesions represented on the left-hand side) and lesion side (left hemisphere lesions on the first row), visualized as a maximum intensity projection. Each subject, longitudinal or not, was counted only once. All masks were registered in MNI ICBM152 2009c symmetric template. Mask count per voxel was divided by the total size of sex subgroups.

