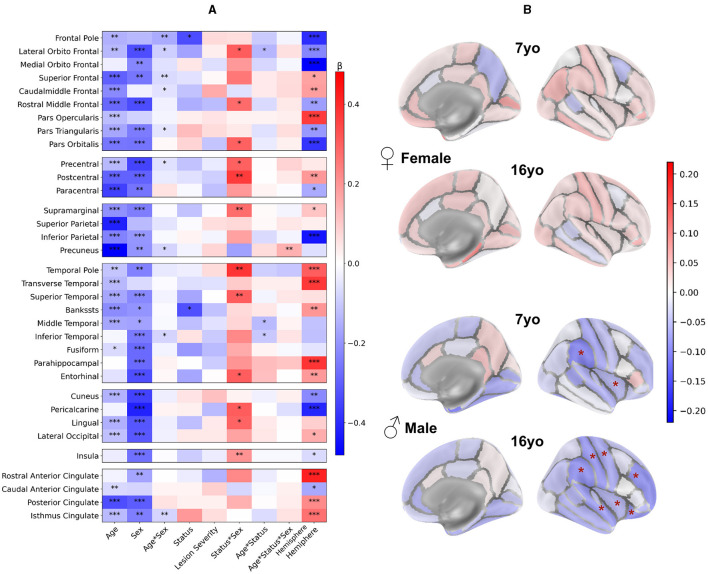
Figure 6.
Contralesional volumes of patients compared to controls in 34 ROIs of Desikan-Killiany parcellation: LMM model and post-hoc tests. Patient volumes are compared to the mean of both hemispheres corresponding values in controls. (A) LMM coefficients values for each region of the DK40 (fixed effects, main interactions, and covariates). *p < 0.05, **p < 0.01, ***p < 0.001. Plotting parameters are the same as in Figure 3. (B) Post-hoc tests comparing patients and controls for each age and sex (patient – controls). Displayed p-values are FDR-corrected (* <0.05). Parameters are the same as Figure 4.

