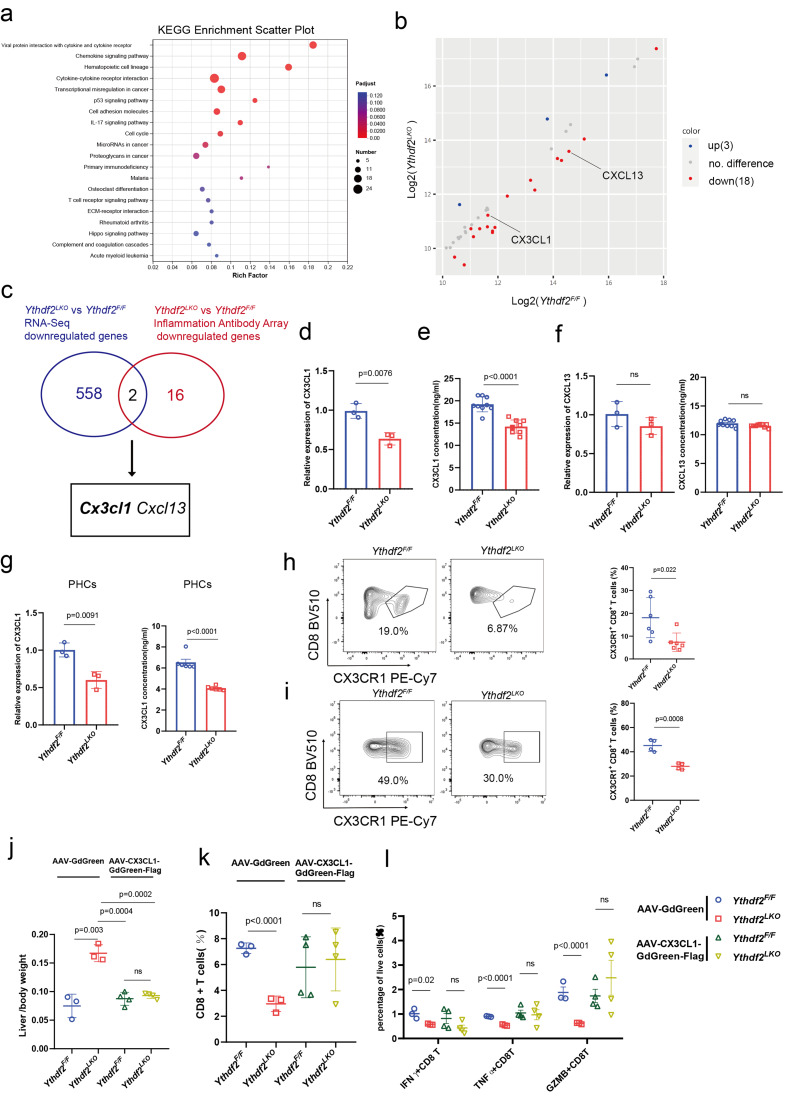
Fig. 4.
YTHDF2 maintains CD8+ T cell-mediated antitumor response through CX3CL1 in hepatocytes. a, KEGG analysis based on the RNA-seq in peritumoral tissues from Ythdf2F/F versus Ythdf2LKO mice after Hepa1-6 orthotopic injection, showing the most significant enriched pathways and the P-values. b, Volcano plots showing up (red) - or down (blue) -regulated genes in serum from Ythdf2F/F versus Ythdf2LKO mice after Hepa1-6 orthotopic injection, as assessed by inflammation antibody array (n = 3). c, Screening strategy showing a group of genes that were concomitant in RNA-seq and inflammation antibody array. d, qRT-PCR analysis of the relative mRNA levels of CX3CL1 in peritumoral hepatocytes from Ythdf2F/F and Ythdf2LKO (n = 3). e, ELISA analysis of the quantitative protein levels of CX3CL1 in the serum from Ythdf2F/F and Ythdf2LKO mice (n = 9). f, qRT-PCR analysis (left) of the relative mRNA levels of CXCL13 in peritumoral hepatocytes from Ythdf2F/F and Ythdf2LKO (n = 3) and ELISA analysis (right) of the quantitative protein levels of CXCL13 in the serum from Ythdf2F/F and Ythdf2LKO mice (n = 9). g, qRT-PCR analysis (left, n = 3) and ELISA analysis (right, n = 6) of CX3CL1 in the PHCs from Ythdf2F/F and Ythdf2LKO mice. h, i Representative plots, percentages of CX3CR1+ CD8+ T cells from Ythdf2F/Fand Ythdf2LKO mice on day 7 after Hepa1-6 orthotopic injection (h, n = 6) and MC38 introsplenic injection (i, n = 4). j-l liver/body weight (j), percentages of CD8+ T cells (k), IFNγ+, TNFα+ and GzmB+ CD8+ T cells (l), from Ythdf2F/F and Ythdf2LKO mice treated with AAV-GdGreen or AAV-CX3CL1-GdGreen-Flag after MC38 intrasplenic injection (n = 3–4). Error bars indicate means ± SD. P-values were determined by an unpaired two-tailed t-test (d-l). Data in d-l are representative of at least two independent experiments. ns, not significant

